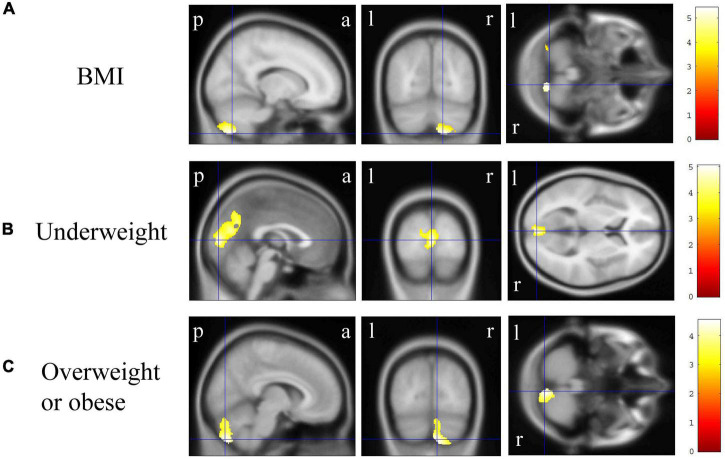
FIGURE 2.
Gray matter regions where the volume was associated with body mass index (BMI), underweight, and overweight or obese individuals. (A) BMI was negatively correlated with gray matter volumes in the bilateral cerebellum exterior [p < 0.01 corrected, Montreal Neurological Institute (MNI) 152 T1 atlas coordinates: x = 15.0 mm, y = −70.5 mm, z = −58.5 mm indicated by blue cross-hair lines]. (B) Gray matter volume in the bilateral cuneus and calcarine cortex, left cuneus, and left precuneus was reduced in underweight individuals when compared with that in non-underweight individuals (p < 0.001 corrected, MNI 152 T1 atlas coordinates: x = 0.0 mm, y = −88.5 mm, z = 6.0 mm indicated by blue cross-hair lines). (C) Gray matter volume in the right cerebellum exterior was reduced in overweight or obese individuals when compared with that in underweight or normal individuals (p < 0.05 corrected, MNI 152 T1 atlas coordinates: x = 7.5 mm, y = −79.5 mm, z = −51.0 mm indicated by blue cross-hair lines). Right-sided gradient color bars represent t-scores. a, anterior; l, left; p, posterior; r, right.

