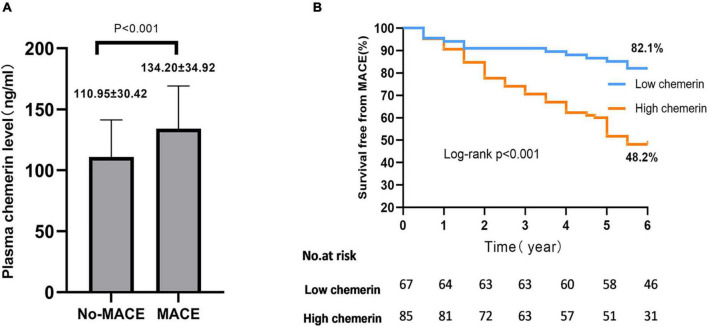
FIGURE 2.
Plasma chemerin concentrations and MACEs-free of high/low chemerin groups in all patients. (A) Plasma chemerin concentrations were higher in the MACE group compared to the non-MACEs group. (B) Kaplan-Meier curves for freedom from MACEs stratified by chemerin group. MACE, major adverse cardiovascular events.

