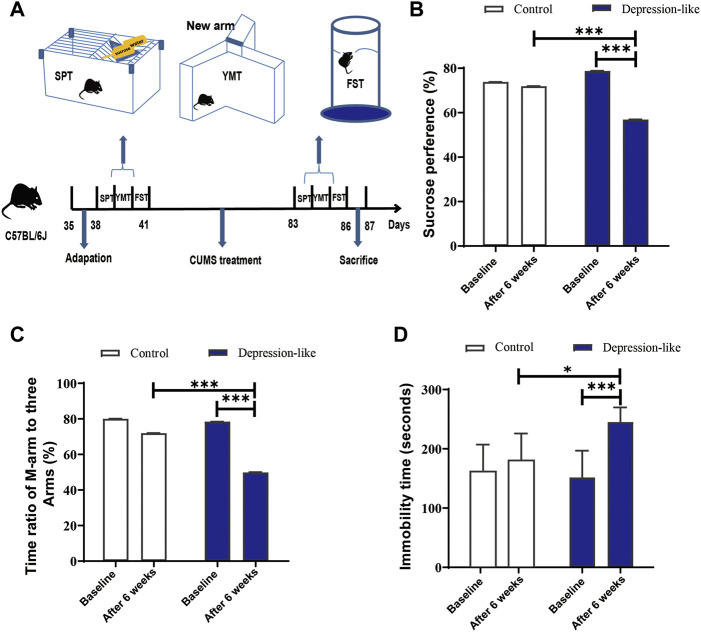
FIGURE 1.
CUMS treatment leads mice to express depression-like behaviors. (A) Diagram of the production of depression-like mice. The procedure includes adaptation for a week, CUMS treatment for 6 weeks, behavioral tests, and definition. (B) SPT values (%) of the control and CUMS mice before and after treatment. (C) Time ratios of the M-arm to three arms before and after treatments in control and CUMS mice. (D) Immobile time of staying in the water cylinder before and after treatments in control and CUMS mice. The paired t-test was conducted for the comparisons before and after the CUMS treatment (***p < 0.001, **p < 0.01, and *p < 0.05). Control (n = 9) and depression-like (n = 14) mice were used to conduct this panel.

