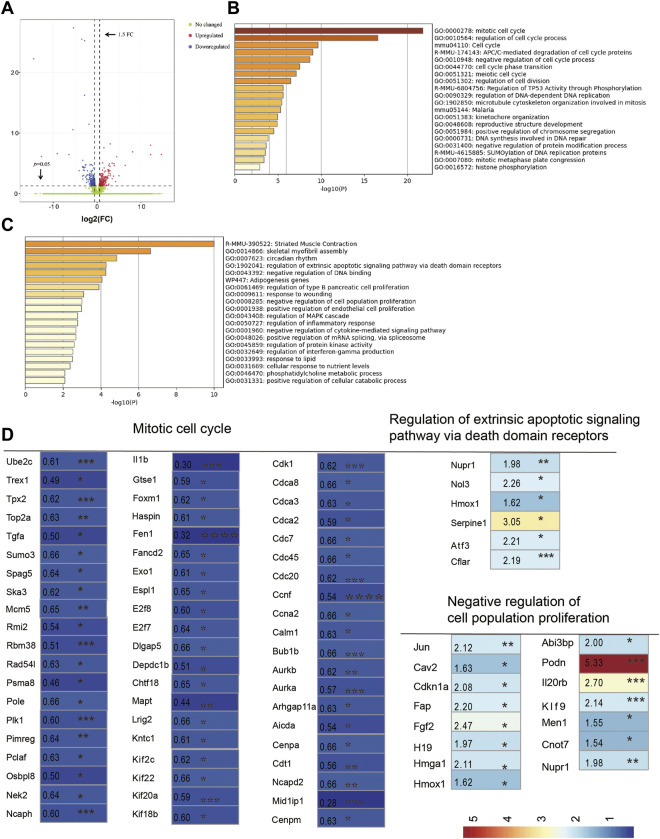
FIGURE 5.
RNA sequencing analysis of ovaries. (A) Volcano plot showed variance in gene expression with regard to fold change and p-value. (B) Pathway and process enrichment analysis of downregulated gene lists (211) in depression-like mouse ovaries, colored by p-values. (C) Pathway and process enrichment analysis of upregulated gene lists (212) in depression-like mouse ovaries, colored by p-values. (D) Heat map was built by a panel of 80 differentially expressed genes, which were annotated in GO terms of the mitotic cell cycle, regulation of the extrinsic apoptotic signaling pathway via death domain receptors, and negative regulation of cell population proliferation (***p < 0.001, **p < 0.01, and *p < 0.05). Student’s t-test was used for the comparisons between depression-like (n = 3) and control mice (n = 3).

