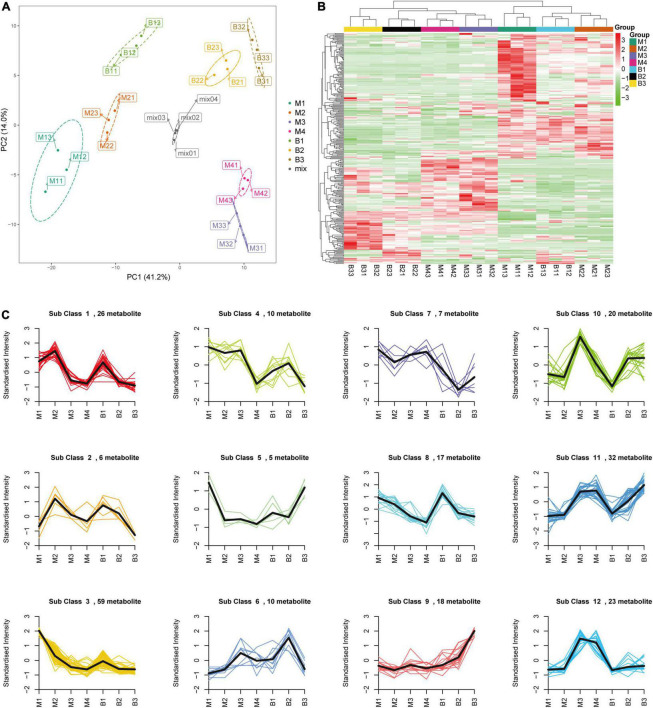
FIGURE 2.
PCA (A), HCA (B), and K-means clustering (C) of the metabolites from the developing pineapple flesh. M1, M2, M3, and M4 represented fruit flesh samples for M at 40, 80, 100, and 120 DAA, respectively, B1, B2, and B3 represented fruit flesh samples for B at 40, 80, and 100 DAA, respectively. In the heatmap, each sample was represented by a single column, and each metabolite was visualized in a row. Red showed high abundance, and green exhibited relatively low metabolite abundance. 12 clusters (Sub class 1–12) of 233 differential metabolites were divided based on the dynamic changes of metabolites from different developmental stages for the two cultivars.

