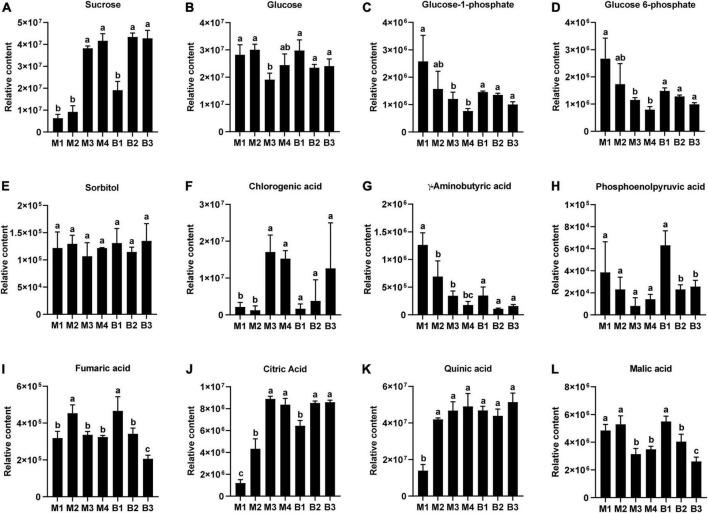
FIGURE 3.
Changes in the relative contents of the main sugars and organic acids in pineapple fruits at four different stages (40, 80, 100, and 120 DAA) for M (M1, M2, M3, and M4) and three different stages (40, 80, and 100 DAA) for B (B1, B2 and B3). (A) Sucrose, (B) glucose, (C) glucose 1-phosphate, (D) glucose 6-phosphate, (E) sorbitol, (F) chlorogenic acid, (G) gamma-aminobutyric acid, (H) phosphoenolpyruvic acid, (I) fumaric acid, (J) citric acid, (K) quinic acid, (L) malic acid. For each cultivar, bars with the same lowercase letter (a, b, or c) indicate no significant differences (p < 0.05).

