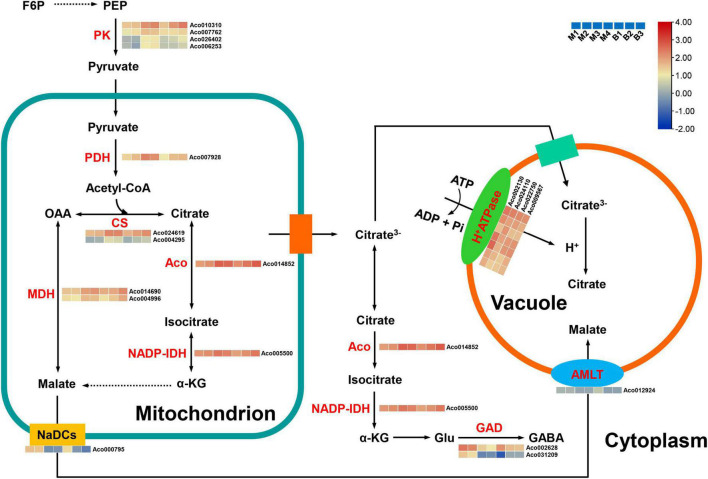
FIGURE 8.
Regulatory model and expression levels of the genes related to citric acid and malic acid metabolism and accumulation in pineapple fruits. From blue to red in the heatmap indicates the expression levels of the genes ranging from low to high in two pineapple cultivars throughout fruit development. M1, M2, M3, and M4 represented fruit flesh samples for M at 40, 80, 100, and 120 DAA, respectively, and B1, B2, and B3 represented fruit flesh samples for B at 40, 80, and 100 DAA, respectively. PK, pyruvate kinase; PDH, pyruvate dehydrogenase; CS, citrate synthase, ACO, aconitase; MDH, malate dehydrogenase; NADP-IDH, isocitrate dehydrogenase NADP; GAD, glutamate decarboxylase; ALMT, aluminum-activated malate transporter; NaDCs, sodium-dependent dicarboxylate transporter. PEP, phosphoenolpyruvate; a-KG, a-ketoglutarate; Glu, glutamate; GABA, γ-aminobutyric acid.

