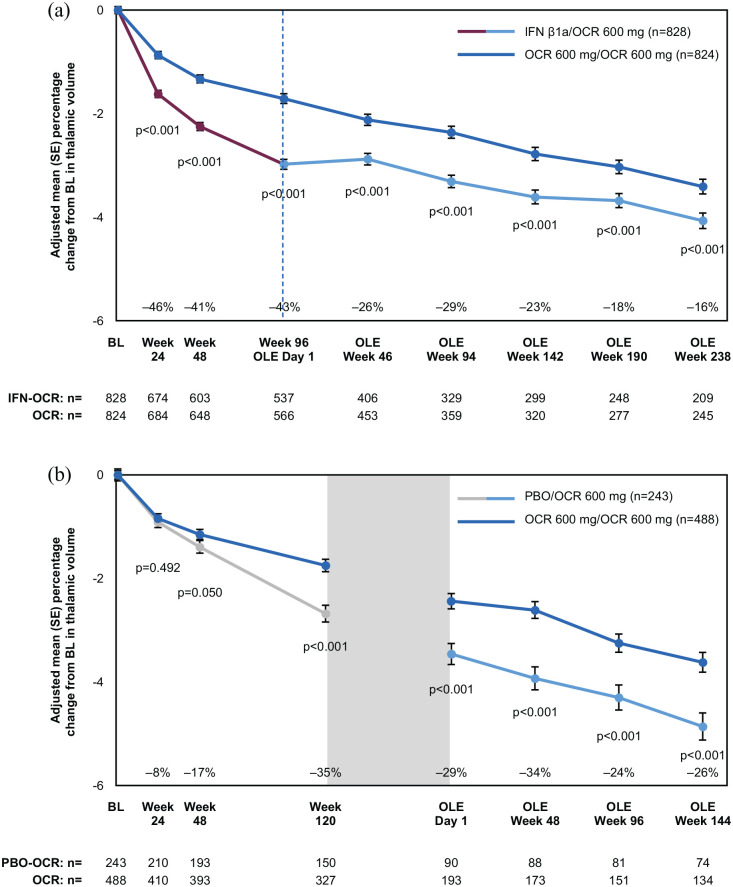
Figure 2.
Treatment effect on thalamic volume loss over time in the RMS (a) and PPMS (b) populations.
BL, baseline; IFNβ1a, interferon β-1a; OCR, ocrelizumab; OLE, open-label extension; PBO, placebo; SE, standard error. Gray box in (b) represents the transition period of PPMS patients switching from placebo to ocrelizumab and entering the OLE from the extended controlled period. Percentage reductions reported in the figure were calculated as: 100 × (ocrelizumab adjusted mean—comparator arm adjusted mean)/(comparator arm adjusted mean).

