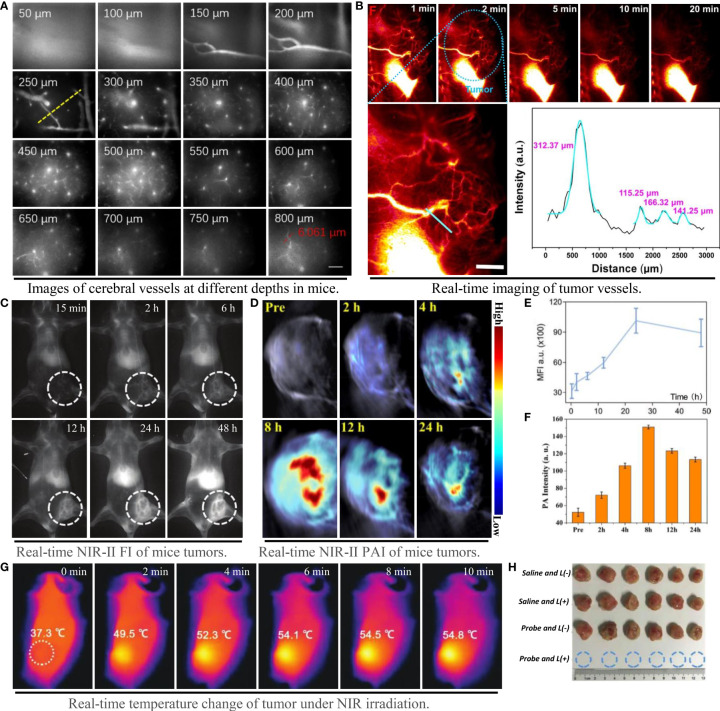
Figure 5.
Imaging capability of NIR-II probe on blood vessels and tumors, and effect of photothermal therapy. (A) Probe IR-820 imaging of cerebral blood vessels in mice at different tissue depths (scale bar: 100 μm) (50); (B) High resolution imaging of tumor vessels at magnification and gaussian fitting curve of vessel cross section (scale bar: 2 mm) (29); (C–E) NIR-II fluorescence imaging and fluorescence intensity of mouse tumors at different time points (31); (D–F) NIR-II photoacoustic imaging and photoacoustic intensity of mouse tumors at different time points (26); (G) Tumor temperature changes at different time points under NIR laser irradiation (18); (H) Tumor photos and volume changes after photothermal treatment under different conditions, from top to bottom: 1) saline; 2) saline + laser; 3) TSSI NPs; 4) TSSI NPs + laser (18).

