Fig. 3.
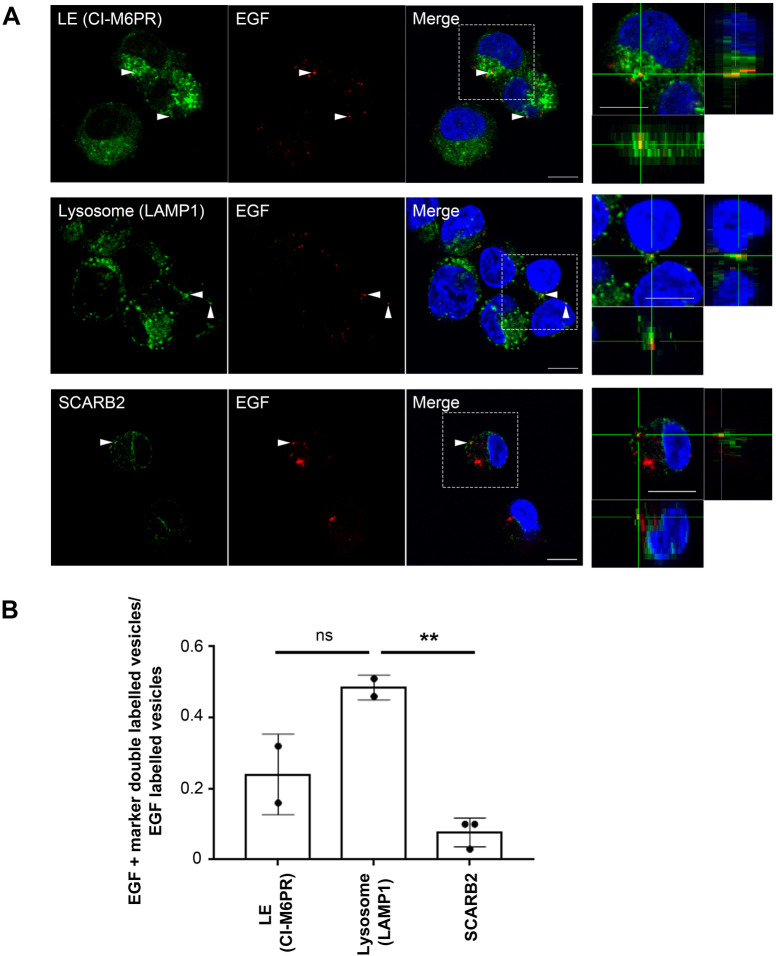
EGF co-localizes with LAMP1 at 30 mai. (A) Co-localization of EGF with M6PR, LAMP1 or SCARB2 is shown by immunofluorescence of EGF and M6PR, LAMP1 and SCARB2. RD-hSCARB2 cells were infected with EV71 and then fixed 30 min after the addition of EGF followed by immunofluorescence. DAPI is in blue, EGF is in green, whereas organelle markers are in red. The panels on the right are enlarged 3D cross-section views of the dashed rectangles in the merged panels. Arrowheads indicate co-localization of EGF with markers. Representative images are shown. Scale bar: 10 µm. (B) Quantification of co-localization of EGF with specific markers. Number of z stack sets was two except SCARB2 was three. ns, not significant, **P<0.01. Statistical significance was determined by a two-tailed, unpaired t-test. Error bars represent s.d.

