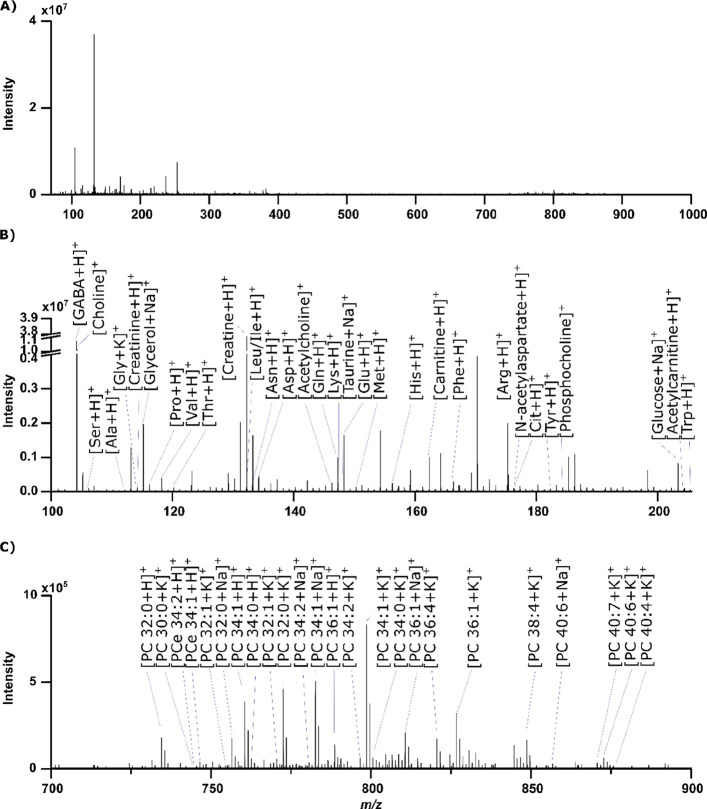
Figure 3.
Single scan, without any averaged microscans, high resolution spectrum in positive ion mode from a methanolic rat brain extract analyzed with DIP-MS. (A) Full spectrum from 70 to 1000 Da, (B) same spectrum zoomed into m/z 100–206 and with several metabolites annotated, and (C) same spectrum zoomed into m/z 700–900 with several annotated lipids. A list of additional putatively annotated peaks is provided in Table S9.

