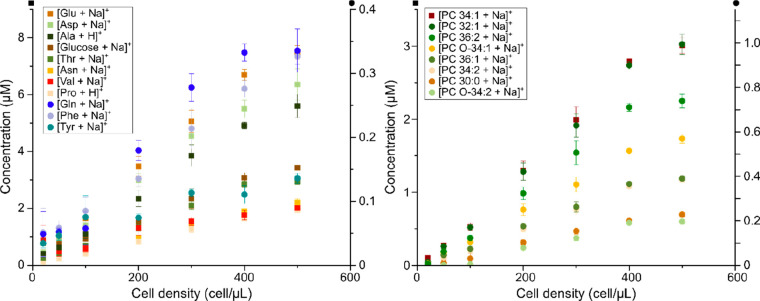
Figure 4.
Quantification of endogenous metabolites and lipids in samples with low cell densities. Concentrations of endogenous (A) small metabolites and (B) phospholipids from 5 μL samples with 20 to 500 cells/μL. Note that the Y-axes are for species depicted as squares (left) and circles (right). Error bars represent one standard deviation of triplicates of sample preparation. n = 3 per cell density, which equals 21 samples in total.

