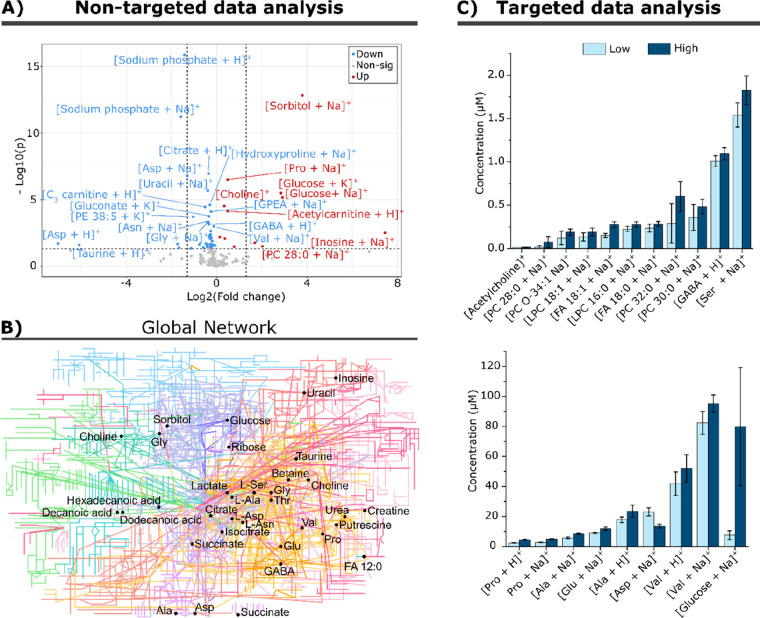
Figure 5.
Nontargeted and quantitative targeted metabolite profiling of INS-1 cells exposed to either low (1 mM) or high (20 mM) glucose. (A) Nontargeted data analysis: Volcano plot originated from the global median normalization of a total of 190 features putatively assigned. A total of 56 metabolites were considered significant (p < 0.05) according to Student’s t test analysis and fold change higher than 1.04. Red and blue correspond to up and down regulated features, respectively, and in gray are the nonsignificant features. (B) Network: The global metabolomic network highlighting in black dots some of the significantly altered metabolites. (C) Targeted data analysis: Concentration of metabolites in INS-1 cell exposed to either low (light blue) or high (dark blue) glucose. All results are significantly different (p < 0.05) between the treatment groups according to two-tailed unpaired homoscedastic Student’s t test analysis. All results refer to the sodiated adducts of each metabolite, except for valine and proline where the protonated adducts are used. Error bars represent one standard deviation of n = 10 of sample preparation from the same batch.

