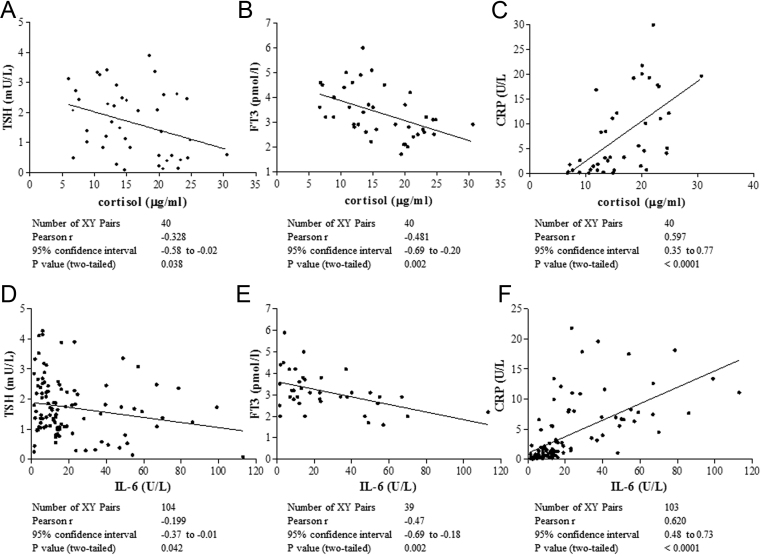
Figure 3.
Significant inverse correlation between TSH, FT3 and C-reactive protein (CRP) levels with total cortisol (top panels) and IL-6 (bottom panels). Top panels: patients taking steroids or aldosterone antagonists were excluded from the analysis. Mean cortisol levels were not significantly different between patients treated with antiretroviral therapy (n = 25) or not (n = 15), data not shown. Bottom panels: values obtained after administration of tocilizumab were excluded from the analysis.

