
Fig. 1.
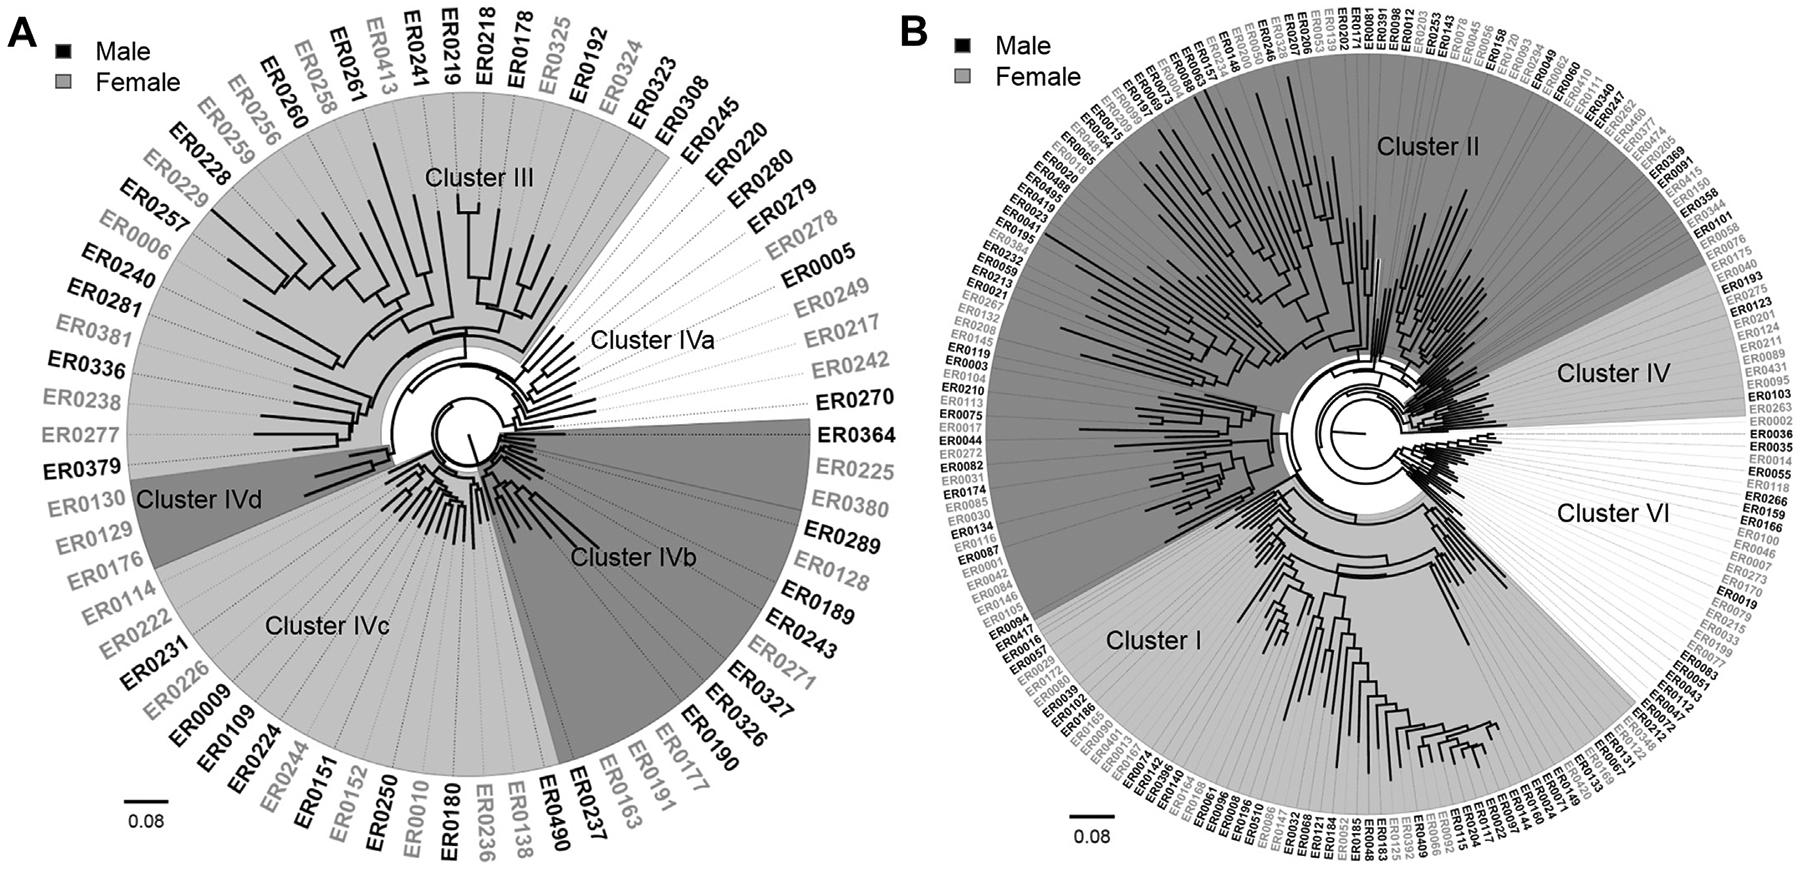
Phylogeny of intestinal microbiota profiles by sex. Hierarchical clustering identified three distinct clusters in (A) healthy family members of patients with enteric infections, and five clusters in (B) the patients. The Neighbor-Joining tree was constructed based on the BrayeCurtis dissimilarity index with 1000 bootstrap replications. Communities from males are labeled in black outside the phylogeny, whereas female communities are labeled in gray.