Figure 2.
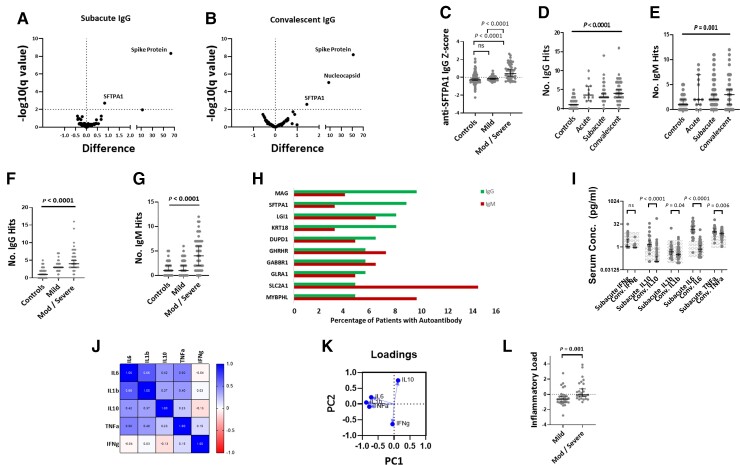
Immune profiling in COVID-19. (A and B) Volcano plots of groupwise comparisons in autoantibody profiles between COVID-19 patients and controls. (C) Relationship between disease severity and anti-SFTPA1 IgG autoantibodies. (D and E) Temporal profiles of IgG and IgM autoantibody responses. (F and G) Effect of disease severity on number of IgG and IgM autoantibody ‘hits’. (H) Top 10 most frequently detected autoantibodies across all samples. (I) Comparison of cytokine profiles at the subacute and convalescent time points, with normal range shown by hatching. (J) Correlation matrix between measured subacute cytokines. (K) Loadings plot from principal component analysis demonstrating the contributions of proinflammatory cytokines to PC1. (L) Comparison in subacute proinflammatory cytokine response between mild and moderate/severe disease (‘Inflammatory Load’ = the inverse of cytokine PC1). Volcano plots use multiple Mann-Whitney U-tests with an FDR rate set to 1%; multiple group comparisons are by Kruskal-Wallis test with post hoc Dunn’s multiple comparison test; two-group unpaired comparisons are by Mann-Whitney U-test, correlation matrix is by Spearman’s rank.

