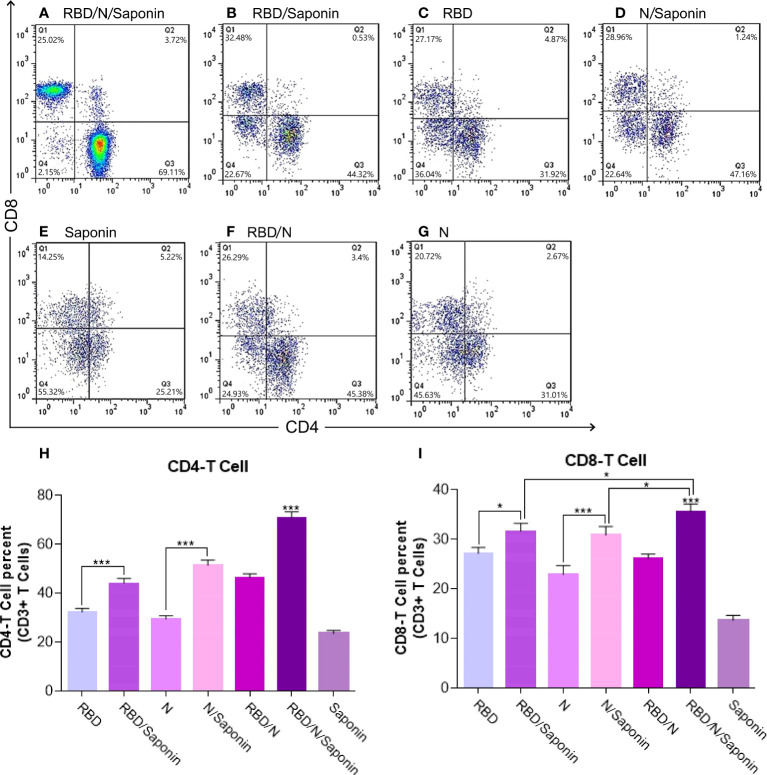
Figure 7.
Flow cytometry analysis of levels of CD3 + CD4+ and CD3 + CD8+ T cells in immunized mice. Mouse spleen mononuclear cells were isolated by density gradient centrifugation on Ficoll-Paque. Three different colors were used for CD3+, CD4+ and CD8+ membrane markers. Gated CD3 positive events were analyzed for CD4 and CD8 production. The graph of flow cytometry represents data of five experiments with similar results. The data represent the means ± standard deviation (SD). Statistical analysis between the four groups were analyzed by one-way ANOVA (*p < 0.05, ***p < 0.001).

