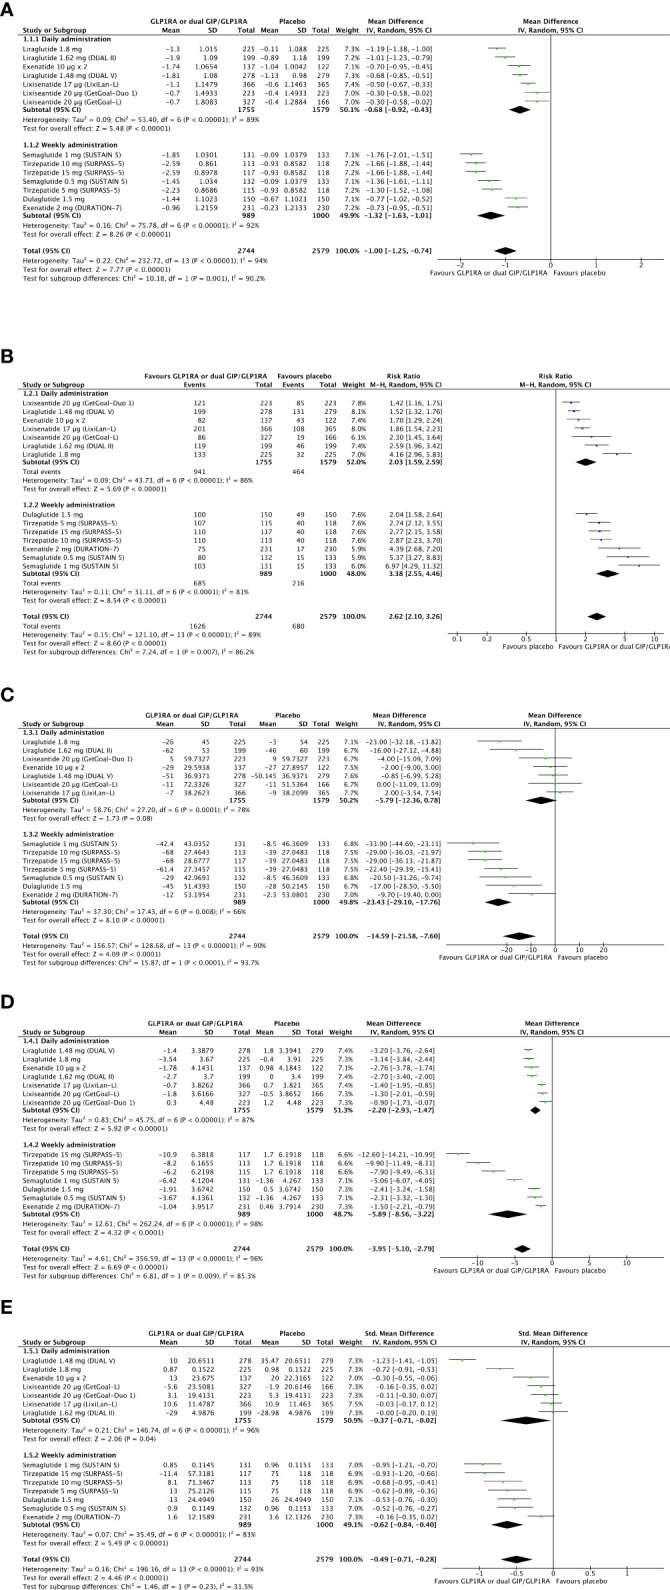
Figure 4.

Forest plots of meta-analysis for change in HbA1c (A), chance of achieving optimal glucose control as HbA1c <7% (B), and change in fasting plasma glucose (C) from baseline to the last available follow-up (intention-to-treat analyses). Forest plot of meta-analysis for change in body weight (D) from baseline to the last available follow-up (intention-to-treat analysis). Forest plot of meta-analysis for change in the mean daily dose of basal insulin (E) from baseline to the last available follow-up (intention-to-treat analysis).
