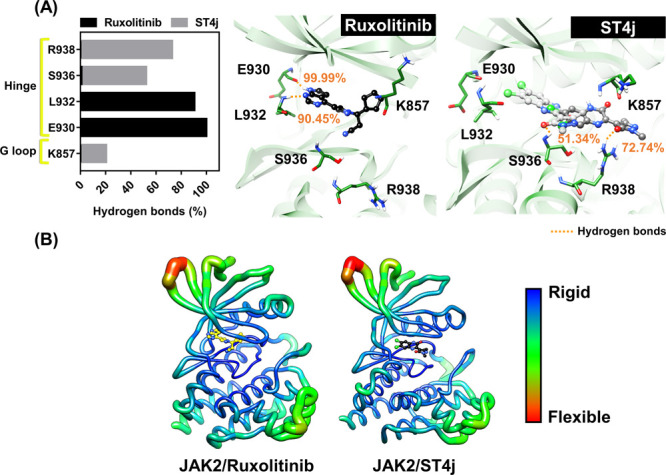
Figure 8.

(A) Percentage of hydrogen bond occupation of ruxolitinib and ST4j within the JAK2 binding pocket. Note that the hydrogen bond with value >50% was selected to represent in 3D and (B) B factor of JAK2, the flexible and rigid regions are ranged from blue to green and red, respectively. The data were derived from the last 100 ns of the one simulation of JAK2 with ruxolitinib (run 1) and ST4j (run 2).
