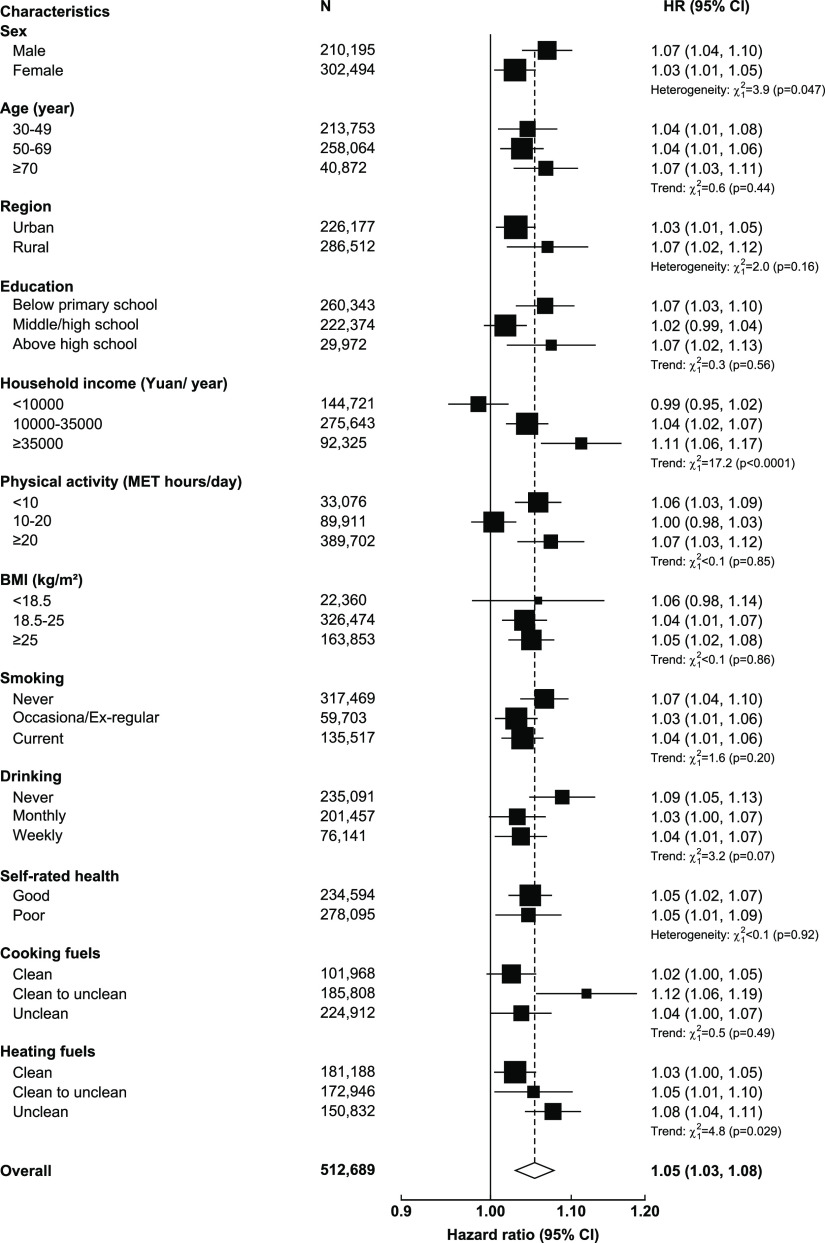
Figure 4.
Adjusted hazard ratios of cardiovascular incidence associated with per 10 μg/m3 in PM2.5 concentrations in selected population subgroups. The black boxes represent hazard ratios (HRs), with the size inversely proportional to the variance of the logarithm of the HRs, and the horizontal lines represent 95% confidence intervals(CI). The open diamond represents the overall HR and 95% CI. Chi-square tests were performed to examine either trend (with 1 df) or heterogeneity (with n-1 df, where n = the number of categories) of HR per 10 μg/m3 PM2.5 across subgroups.

