
Figure 2.
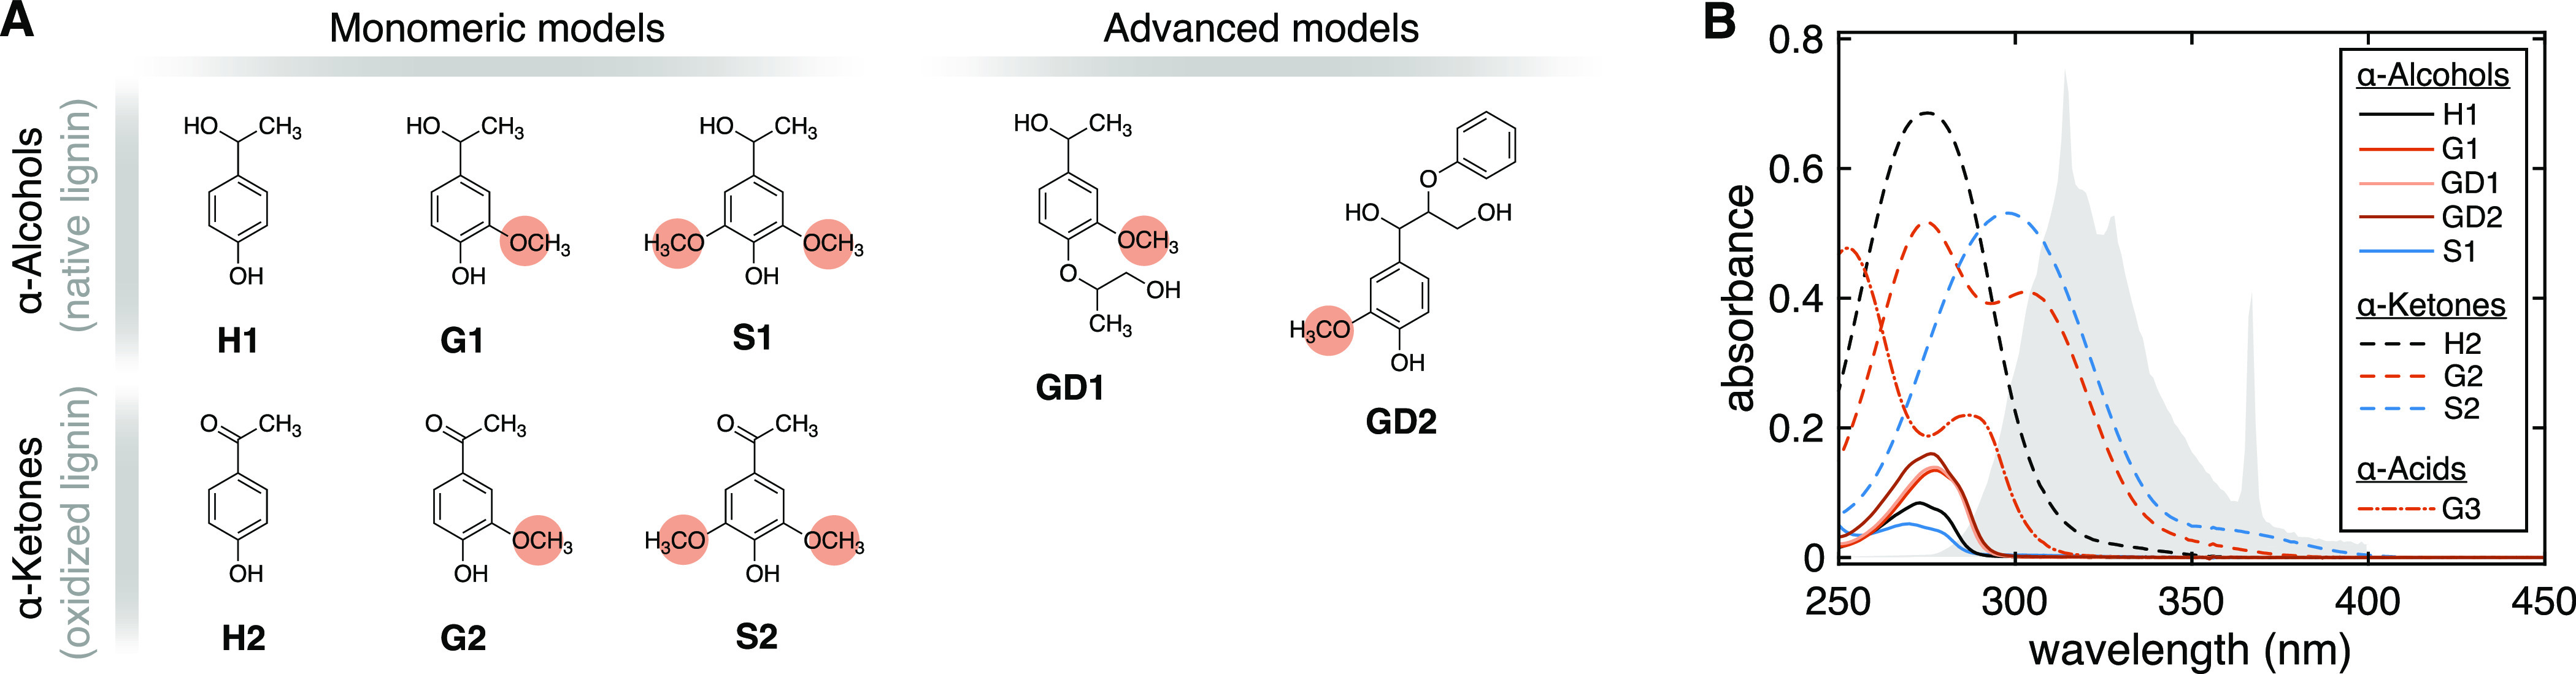
(A) Molecular structures and abbreviations of the lignin model compounds employed in this study. Orange highlights indicate the aromatic methoxy groups proposed as the CO precursors. (B) UV–vis absorption spectra of aqueous solutions used for irradiation experiments (≈50 μM, unbuffered). Each compound is identified by a line type (continuous line, α-alcohol; dashed line, α-ketone; dash-dot line, α-carboxylic acid) and a color (black, H = 0 × -OCH3; shades of red, G = 1 × -OCH3; blue, S = 2 × -OCH3). The gray area is the normalized UV lamp spectrum (max at 313 nm) in arbitrary units corrected for the absorption of the borosilicate test tubes. G3 is vanillic acid.