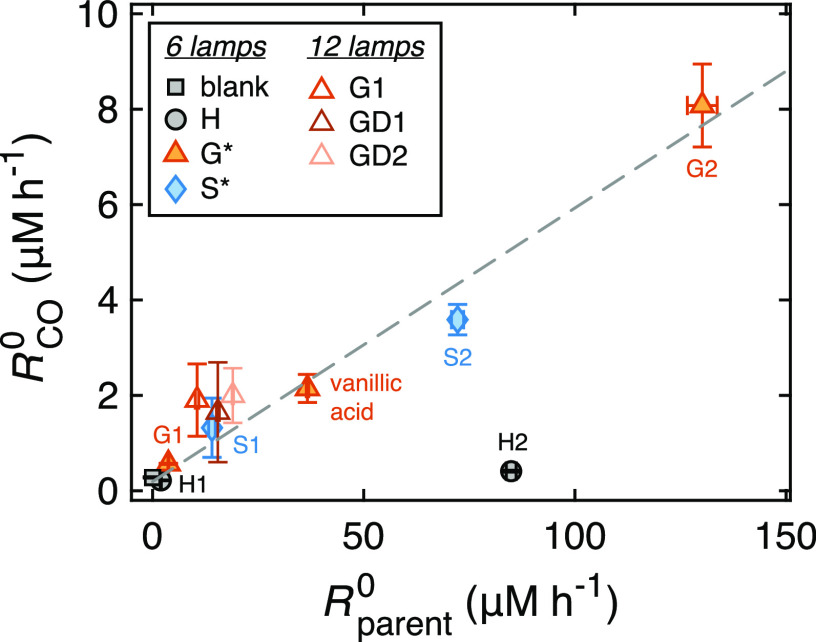
Figure 3.
Correlation between initial CO production rate (RCO0) and initial substrate degradation rate (Rparent; numeric data in Table S2). Experiments were performed with 6 (filled symbols) or 12 (empty symbols) UV lamps. Data for S and G monomers measured with six lamps were fitted to a linear regression model (starred in legend), yielding y = (0.057 ± 0.005) · x + (0.19 ± 0.36) (R2 = 0.97, p < 0.0017, N = 5; gray dashed line).

