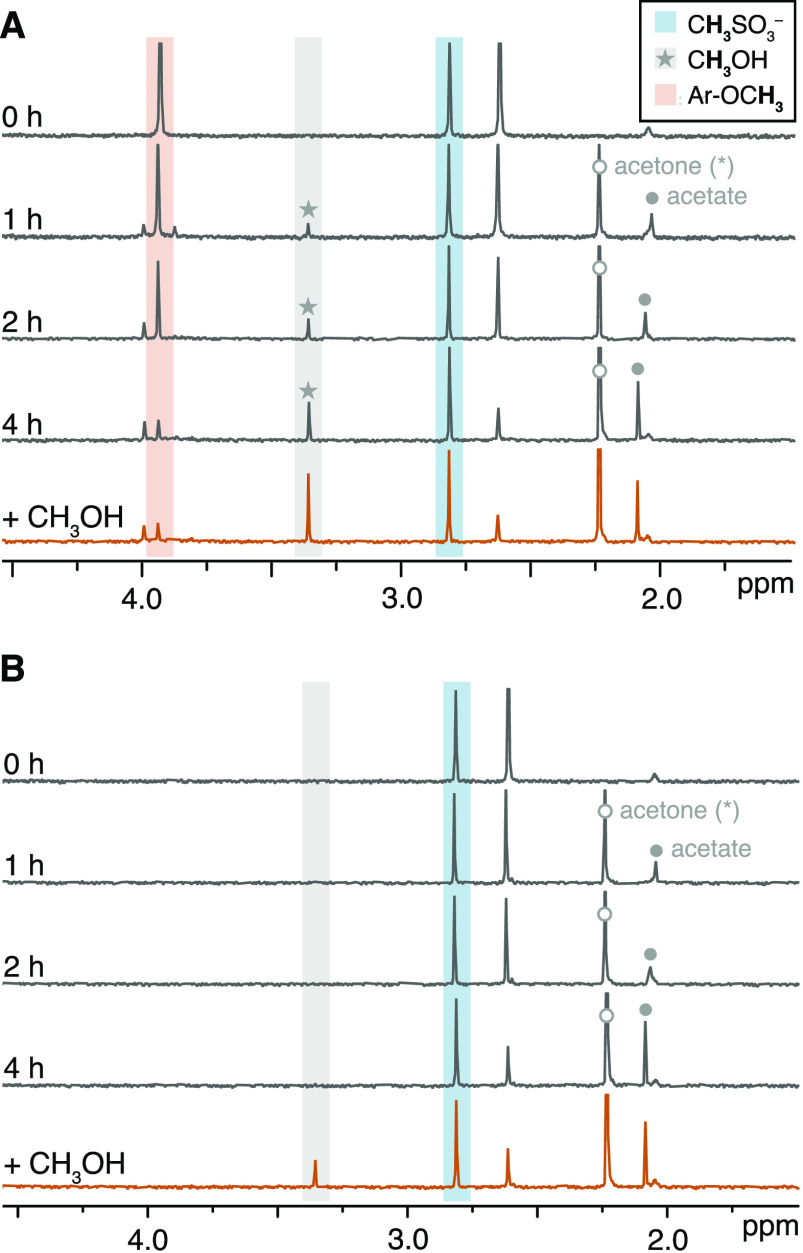
Figure 4.
1H NMR spectra of G2 (A) and H2 (B) in D2O during 4 h of UV irradiation (dark gray traces). At the end of the experiment, we added methanol (+0.18 mM) to confirm its occurrence as a reaction product (orange traces). Gray areas represent CH3OH (3.36 ppm), blue areas denote the internal standard (CH3SO3–, 2.81 ppm), and orange areas represent the resonance range of ArOCH3 protons. Additional relevant signals are indicated with a filled circle (acetate, 2.03–2.08 ppm) or an empty circle (acetone, 2.23 ppm). Note that acetone is not a reaction product. 1H NMR spectra of other substrates are in Figure S9.

