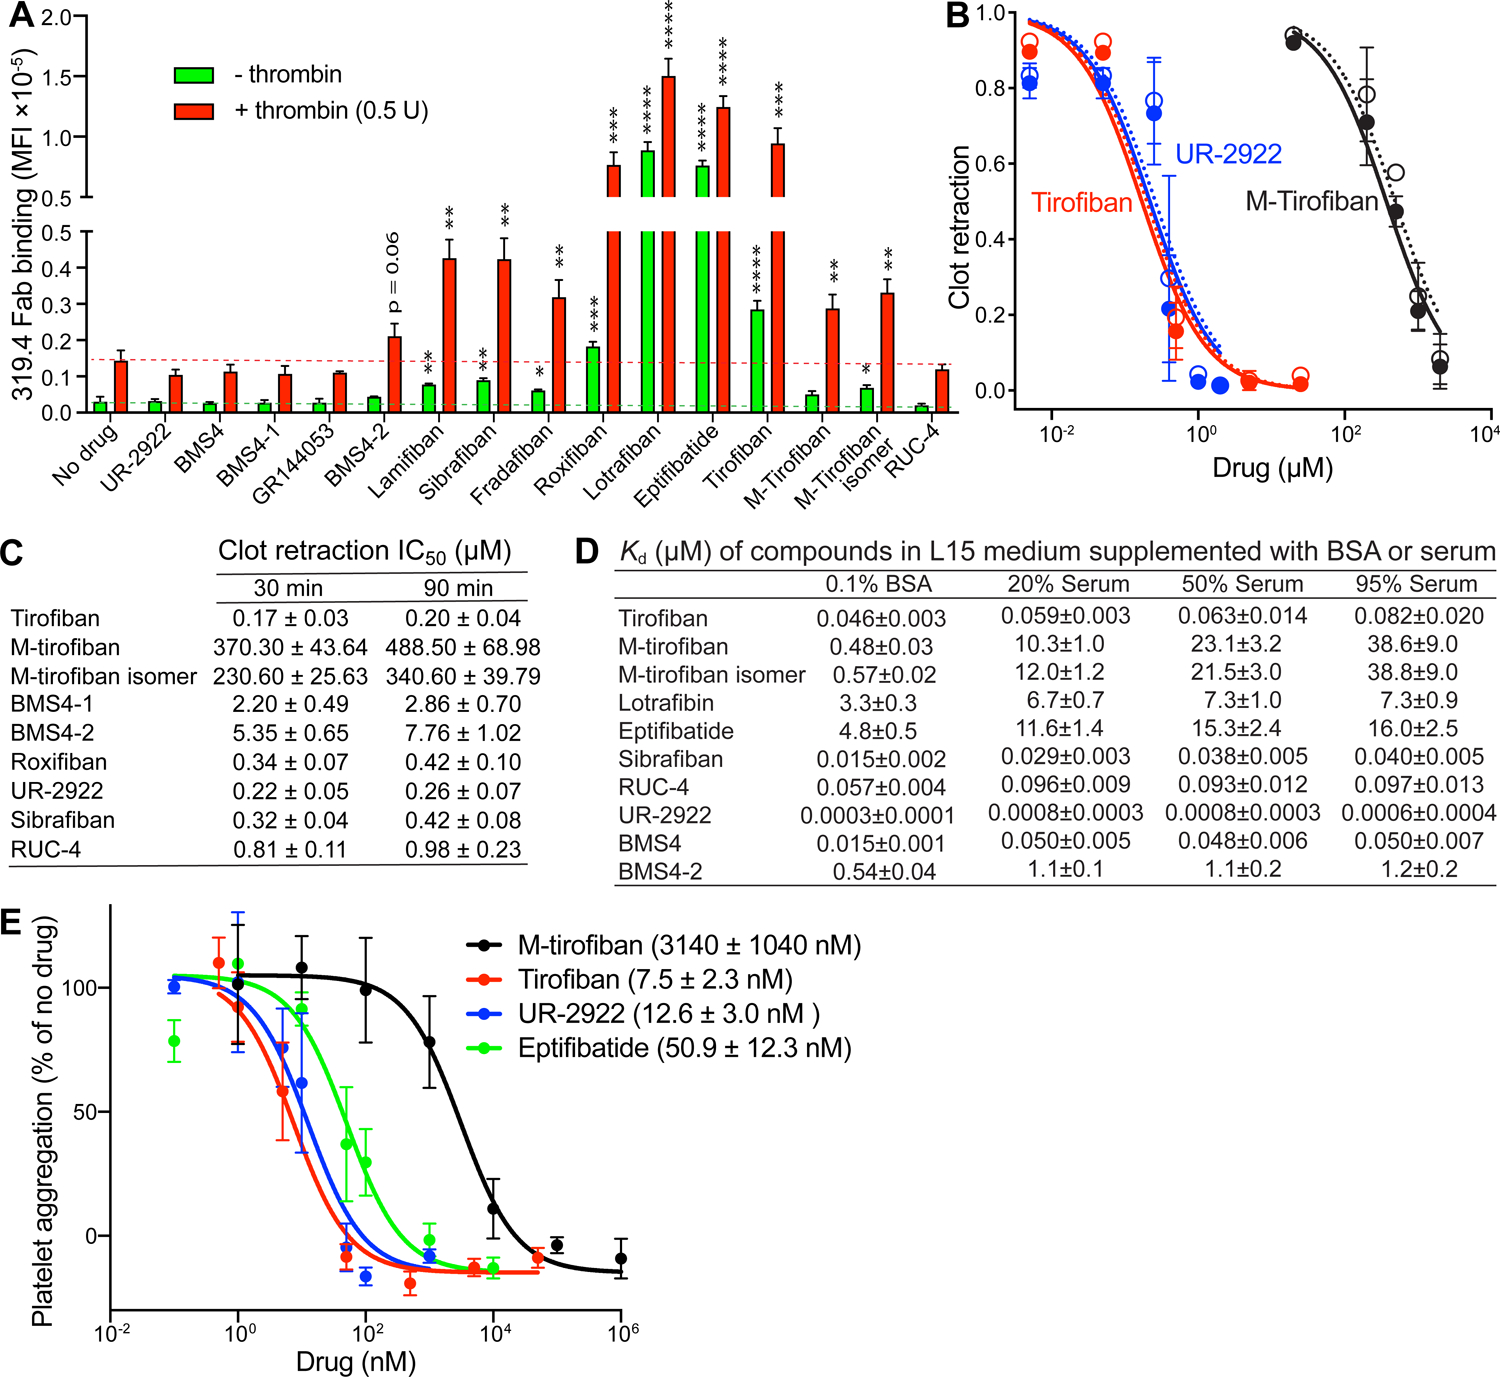
FIGURE 7. Platelet assays and effect of serum on the affinity of αIIbβ3 inhibitors.

(A) Platelet LIBS exposure. Washed human platelets were pre-incubated with buffer control or αIIbβ3 inhibitors and then treated with or without 0.5 U/ml thrombin and 25 nM Alexa647-conjugated MBC319.4 Fab. Binding was measured by flow cytometry and shown as MFI. Data are mean ± s.d. from three independent experiments. Unpaired two-tailed t test was between the inhibitor and control groups; * p < 0.05; ** p < 0.01; *** p < 0.001; **** p < 0.0001. (B) Plots of inhibition of clot retraction (1 – (clot area/whole reaction area)) for three representative αIIbβ3 inhibitors measured at 30 mins (closed circles) and 90 mins (open circles). (C) IC50 values for inhibition of clot retraction by αIIbβ3 inhibitors. (D) Binding affinities of αIIbβ3 inhibitors determined by competing with FITC-echistatin binding to WT αIIbβ3 transfectant in L15 medium supplemented with 0.1% BSA (from Fig. 6) or with different concentrations of serum (Supplementary Fig.S5 B, C). values were determined from nonlinear least square fits (Eq.4, Methods). Errors are standard fitting errors from nonlinear least square fits. Experiments were repeated multiple times with similar results. (E) Inhibition of whole blood platelet aggregation by selected αIIbβ3 inhibitors measured by impedance aggregometry. Data are mean ± s.e.m. (n = 3 different donors). See also Figures S5, S6, and S7.
