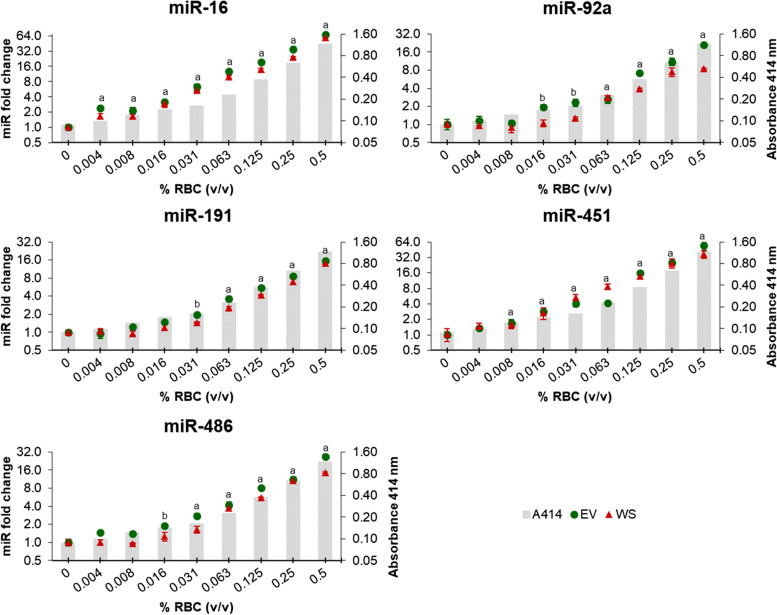
Fig. 2.
Relative abundance of miRNAs sensitive to haemolysis in whole serum (WS) and serum-derived extracellular vesicles (EV) groups in canine sera from the constructed haemolysis series. Grey columns in the background depict increasing levels of RBCs (% v/v), measured using the haemoglobin absorbance at 414 nm. Fold changes were calculated relative to the non-haemolysed control sample (0.0% RBCs) and normalised using spike-in ssc-miR-292-3p and hsa-miR-934. Experiments were performed in triplicate and markers show the mean ± SD (bars). Statistical significance is represented with an (a) in both groups (WS and EV) and with a (b) in EV group compared to the non-haemolysed control sample (0.0% RBCs). P ≤ 0.05, unpaired t-test. RBCs: red blood cells

