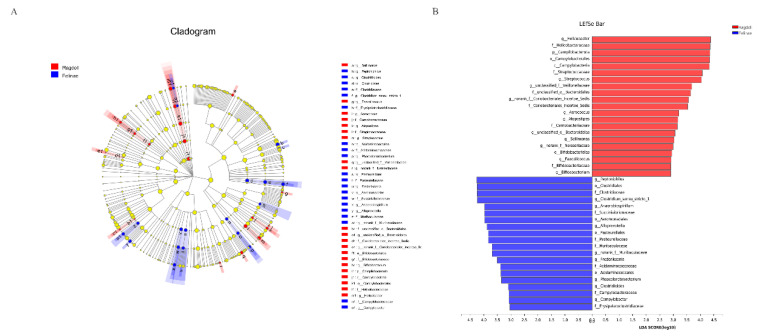
Figure 5.
The linear discriminant analysis effect size (LEfSe) reveals the most featured bacterial taxa in the feline gut microbiota. The cladogram represents the discriminative features of the taxa between the two groups (A). The LDA coupled with effect size measurements identified the most differentially abundant taxa between the two groups (B).

