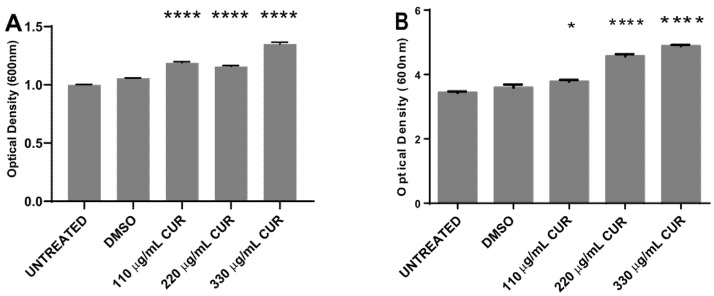
Figure 2.
Dose–time response curves comparing curcumin (CUR) treatment in S. enterica ser. Typhimurium growth (OD600), and for cells incubated in the presence of dimethyl sulfoxide (DMSO). Curves are representative of at least 3 different assays. (A) After 4 h of incubation. (B) After 12 h of incubation. (* p < 0.05, **** p < 0.0001).

