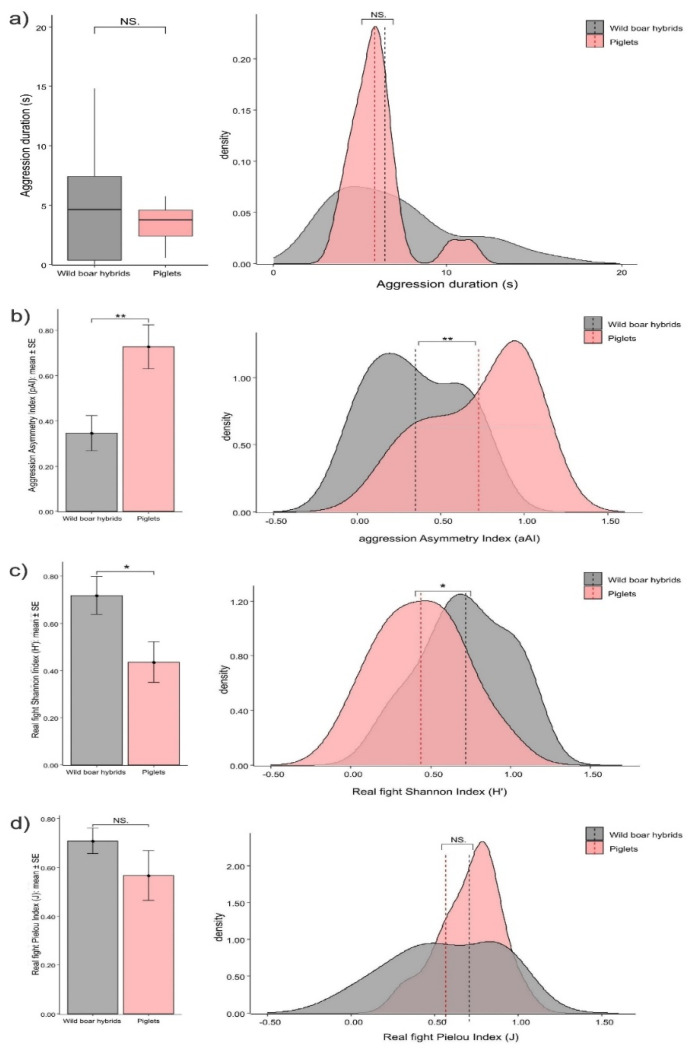
Figure 5.
Differences in aggression duration between piglets and wild boar hybrids shown as bar plot (left) and density plot (right). (a) Piglets and wild boar hybrids show comparable levels in the aggression duration (Mann–Whitney exact test; p = 0.539) Density plot: vertical, dashed lines indicate median value. Bar plot: horizontal line: median value; box: interquartile range; vertical line: minimum and maximum values in the data. Difference in real fighting between piglets and wild boar hybrids shown as error bar plot (left) and density plot (right). (b) Asymmetry Index (aAI) values; piglets show top levels of asymmetry (t-test for independent samples; p = 0.007). (c) Shannon Index (H′) values; piglets show the lowest levels of real fight variability (t-test for independent samples; p = 0.027). (d) Pielou Index (J) values; piglets and wild boar hybrids show comparable levels of real fighting in the Pielou Index (evenness) (t-test for independent samples; p = 0.239). Density plot: vertical, dashed lines indicate mean value. Bar plot: vertical bars. Standard Error (SE) around the mean (circles). NS = non-significant, * = p < 0.05, ** = p < 0.01.

