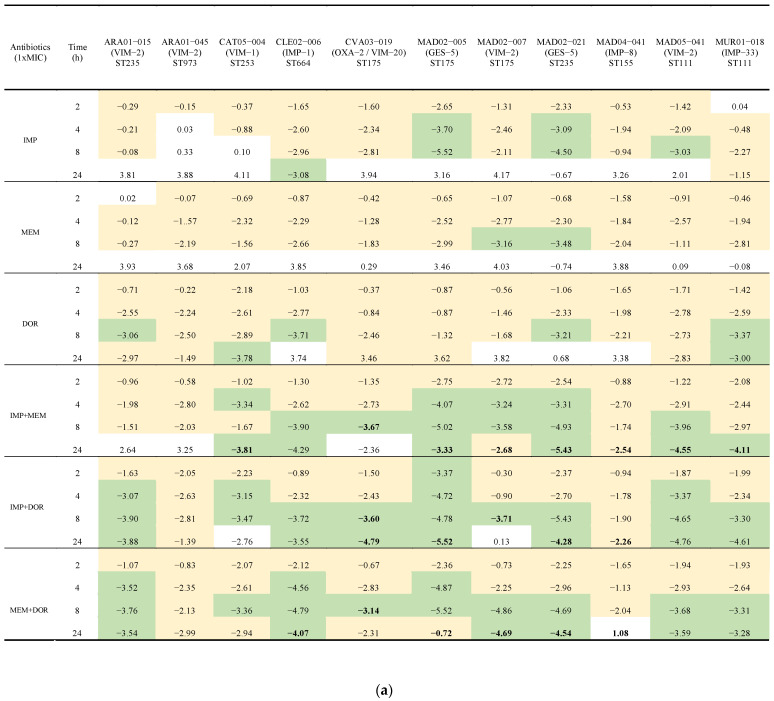
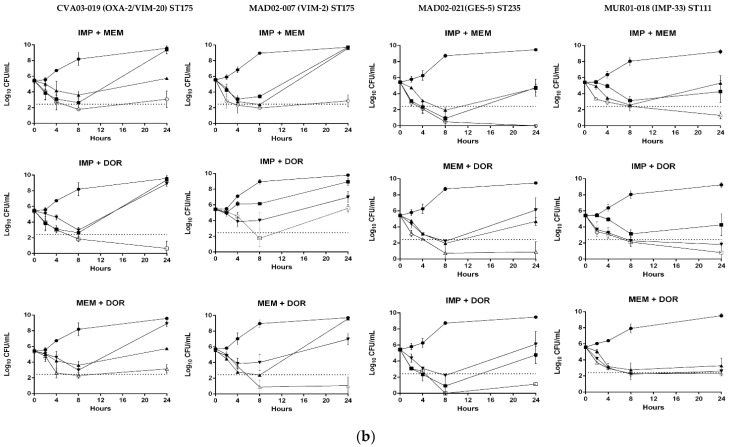
Figure 1.
(a) Time-kill assays for imipenem, meropenem, and doripenem alone and in combination at MIC concentrations against eleven isolates of carbapenemase-producing P. aeruginosa isolates. Results are represented as differences (log10 CFU/mL) relative to the initial time point (0 h). Green indicates a >3 log10 CFU/mL decrease, yellow a <3 log10 CFU/mL decrease. Bold represents synergistic activity with respect to the most active drug alone at that time point. IMP: imipenem; MEM: meropenem; DOR: doripenem. (b) Time-kill assays for imipenem, meropenem, and doripenem alone and in combination at MIC concentrations against the four carbapenemase-producing P. aeruginosa isolates selected for in vivo studies. Solid circle: growth control; Square: imipenem (IMP); Triangle: meropenem (MEM); Inverted triangle: doripenem (DOR); Empty circle: IMP + MEM; Empty square: IMP + DOR; Empty triangle: MEM + DOR; Dotted line: bactericidal activity.


