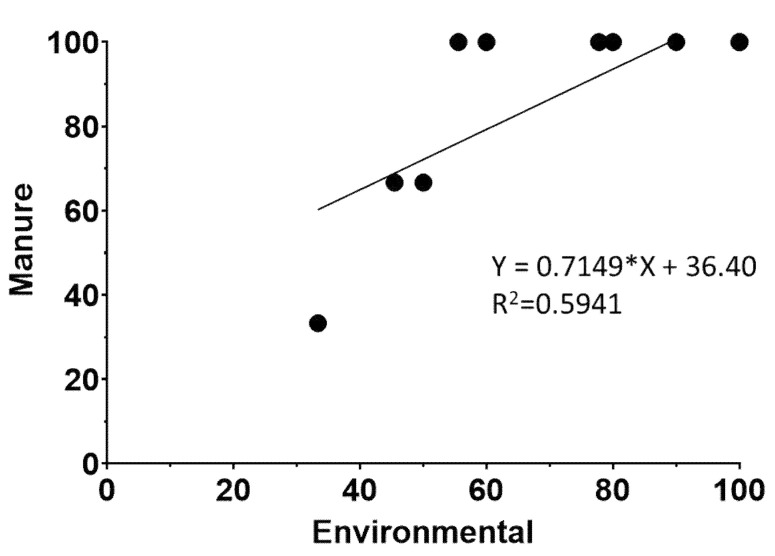
Figure 1.
Scatter plot of percentage of L. monocytogenes positive manure samples versus L. monocytogenes positive environmental samples. Regression equation and R2 values are determined by regression analysis as described in Material and Methods. The (*) in the equation corresponds to the multiplication sign.

