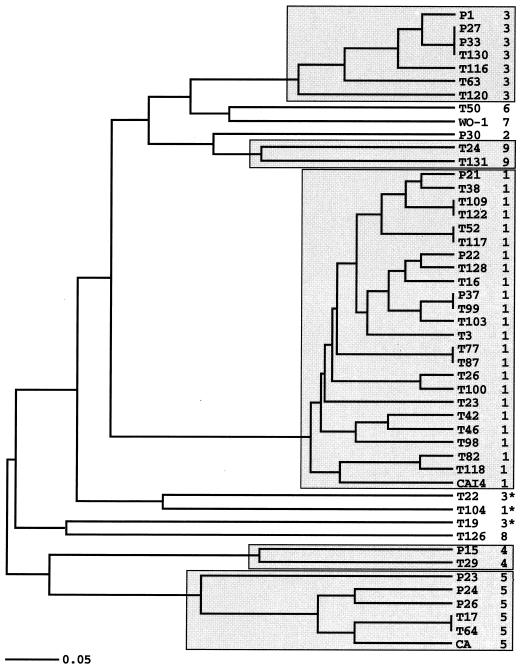
FIG. 4.
UPGMA tree of similarity in nuclear DNA genotypes (5). The scale is the fraction dissimilar from zero to one. Boxes enclose distinct clusters of nuclear genotypes that also corresponded to mtDNA haplotypes. Asterisks designate strains of haplotypes 1 and 3 with exceptional nuclear genotypes.

