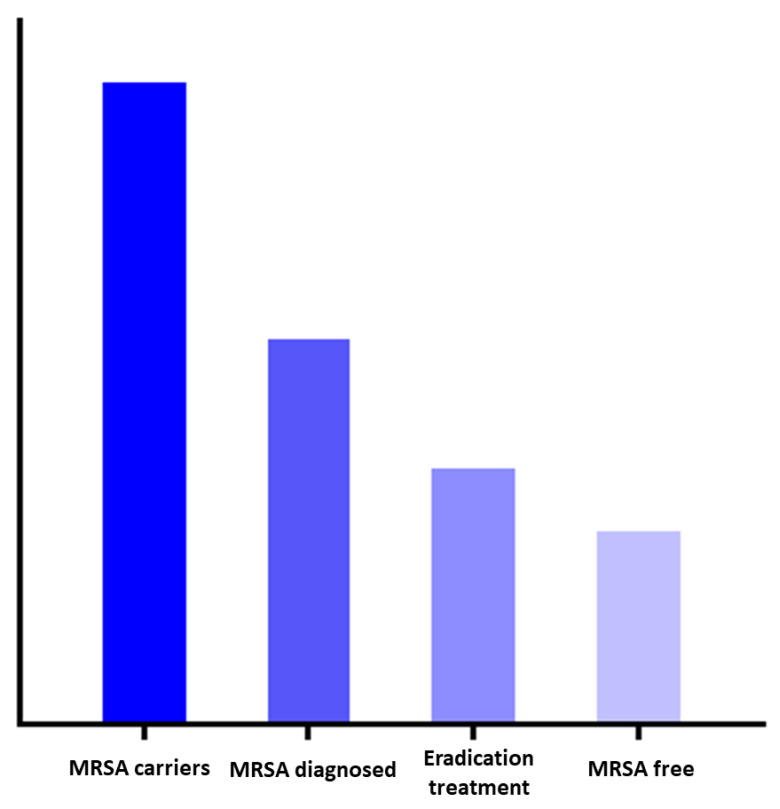
Figure 1.
Conceptual graphic of the cascade of care in MRSA decolonization. Legend: The first column addresses the total number of MRSA carriers in the Netherlands. The second column represents the proportion of carriers that is diagnosed. The third column addresses the MRSA carriers that are diagnosed and undergo eradication treatment. The last column represents the success rate of complicated MRSA eradication treatment. In every step of this conceptual cascade of care, there is the potential for leakage. As this figure represents a conceptual model, the columns are not quantified.

