
Figure 5.
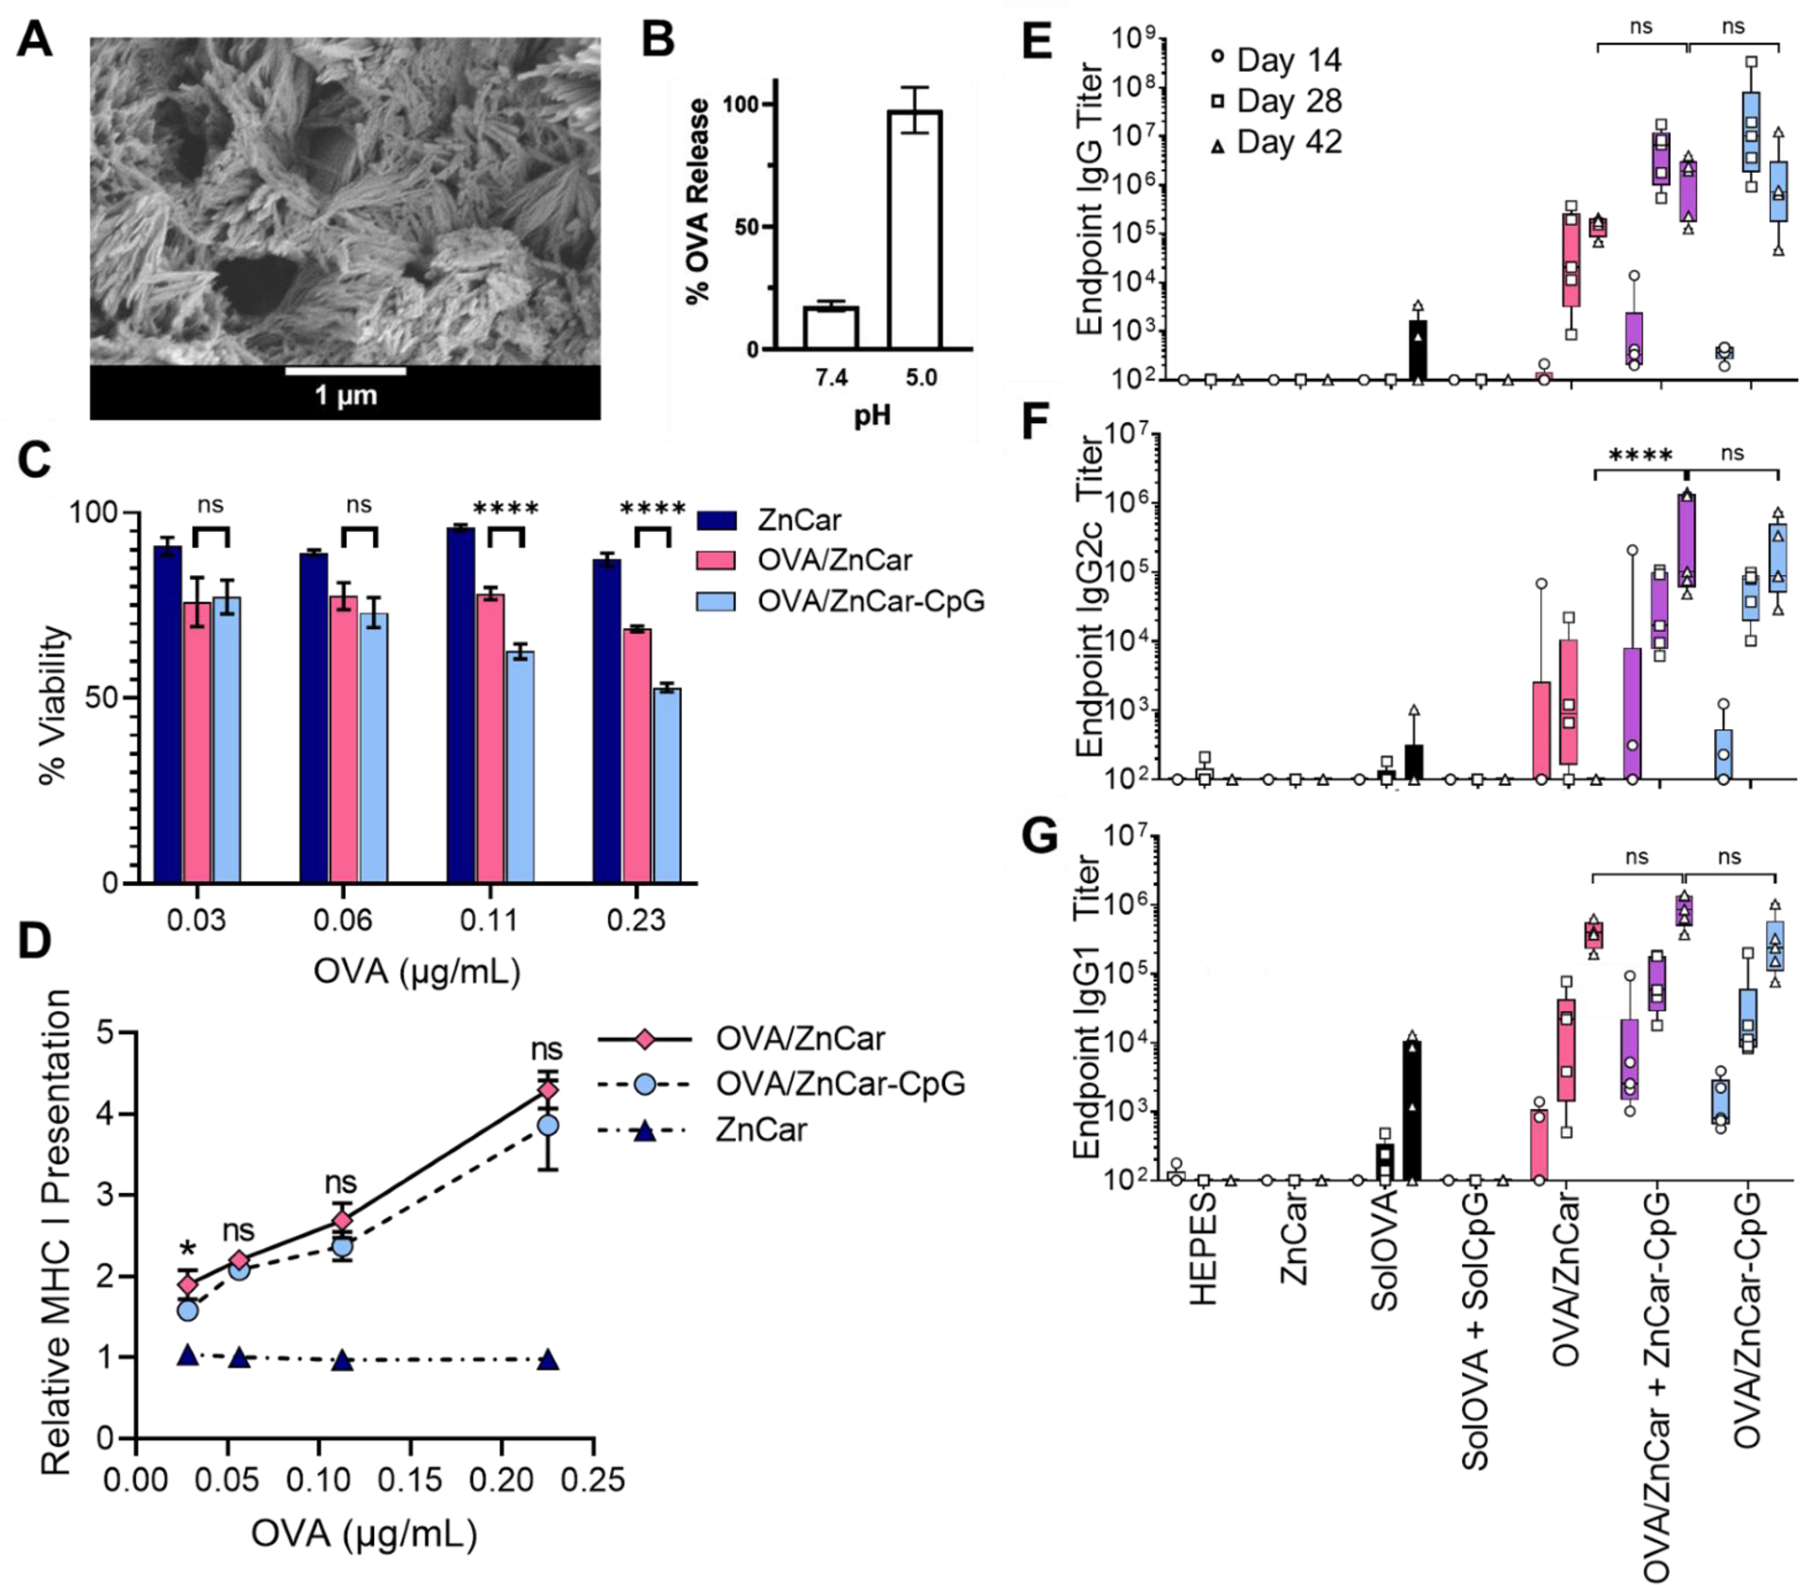
(A) Scanning electron micrograph of OVA/ZnCar. (B) OVA release from OVA/ZnCar after 24 h at pH 7.4 and 5.0. (C) Cell viability of DCs (DC2.4s) incubated with different concentrations of ZnCar, OVA/ZnCar, and OVA/ZnCar-CpG for 24 h measured by MTT assay. Empty ZnCar did not contain OVA and contained equivalent concentration of ZnCar as OVA/ZnCar material at indicated concentrations. Data is presented as average ± standard deviation (n=3). % Viability is normalized to media only control. One-way ANOVA coupled with Tukey’s correction for multiple comparisons was performed and significance between OVA/ZnCar and OVA/ZnCar-CpG is indicated as follows: **** = p ≤ 0.0001. (D) Relative MHC I presentation by DCs (DC2.4s) for ZnCar, OVA/ZnCar, and OVA/ZnCar-CpG. Data is presented as the average fold change vs. soluble protein ± standard deviation (n=3). One-way ANOVA coupled with Tukey’s correction for multiple comparisons was performed and significance between the OVA/ZnCar and OVA/ZnCar-CpG groups is represented as * = p ≤ 0.05. OVA-specific (E) total IgG, (F) IgG2c, and (G) IgG1 antibody titers of mice (n=5 per group) vaccinated intramuscularly on days 0 and 21 with indicated experimental groups. Groups receiving OVA received 10 µg per mouse per dose. Groups receiving CpG received 10 µg per mouse per dose. Data is presented as average ± standard deviation. One-way ANOVA coupled with Tukey’s correction for multiple comparisons was performed for day 42 titers and significance is indicated as follows: **** = p ≤ 0.0001. ns = not statistically significant.