
Figure 6.
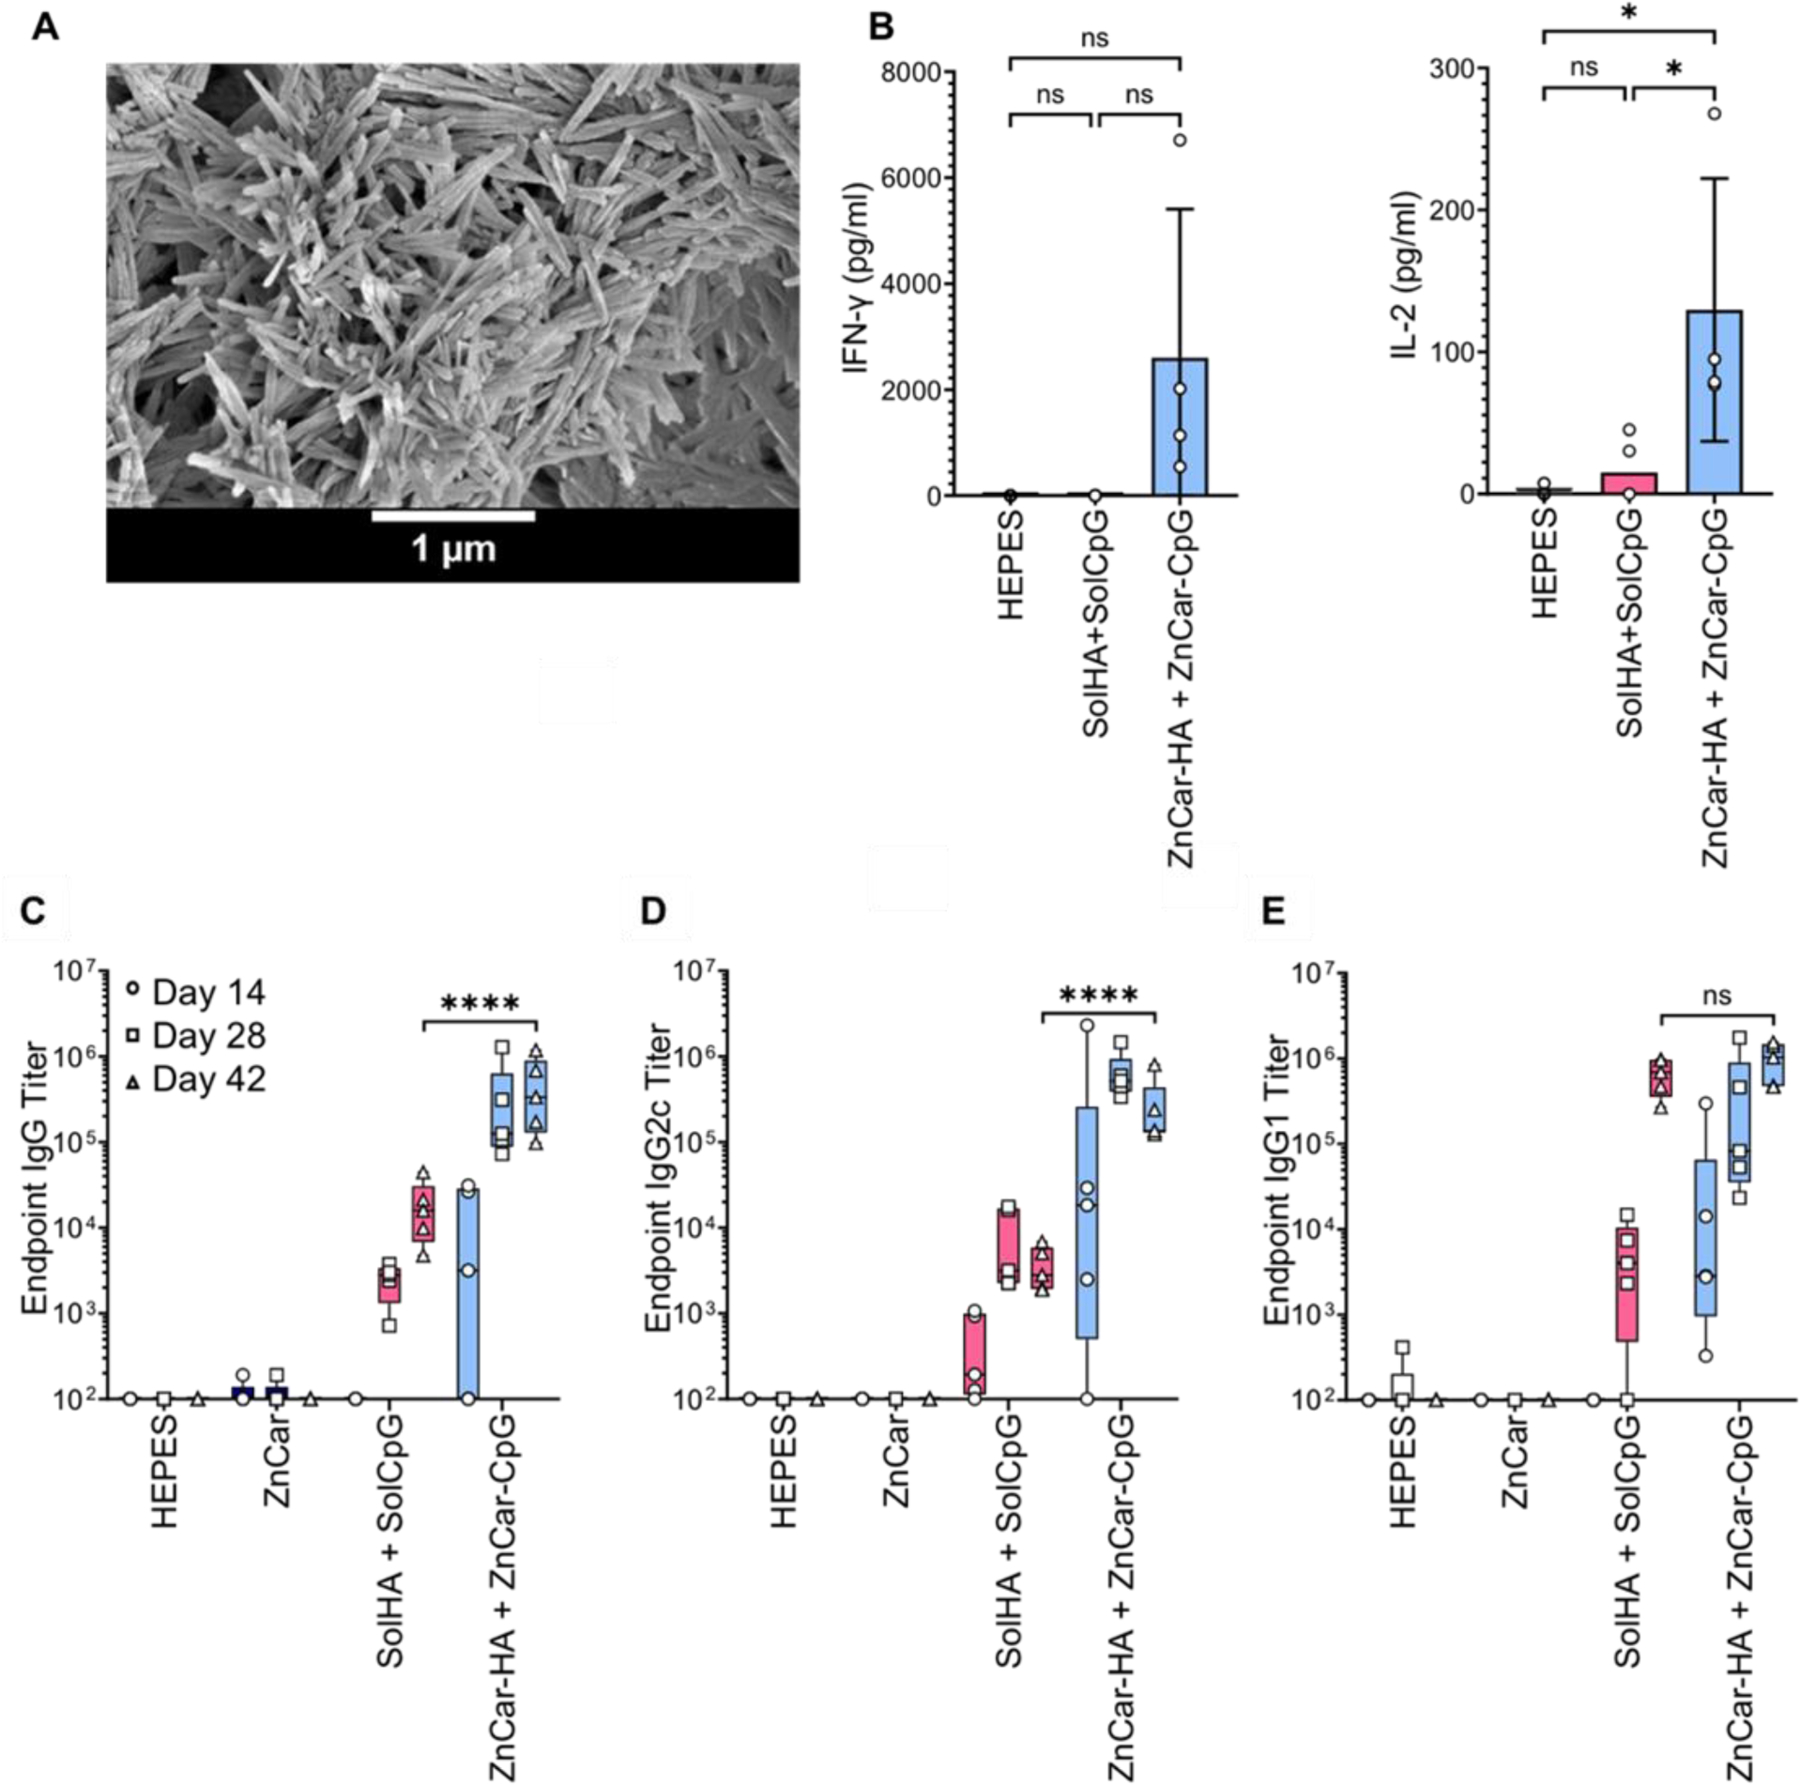
(A) Scanning electron micrograph of ZnCar-HA. (B) Secretion of IL-6 and TNF-α incubated with indicated concentrations of HEPES, solHA + solCpG, and ZnCar-CpG + ZnCar-HA, where “sol” stands for soluble. Concentration of IL-6 and TNF-α were determined by ELISA. Data is presented as average ± standard deviation (n=4 to 5) One-way ANOVA coupled with Tukey’s correction for multiple comparisons was performed and significance is indicated as follows: * = p ≤ 0.05. Serum HA-specific (C) total IgG, (D) IgG2c, and (E) IgG1 antibody titers of mice (n=5 per group) vaccinated intramuscularly on days 0 and 21 with indicated experimental groups. Groups receiving HA received 10 µg per mouse per dose (HA type: COBRA P1). Groups receiving CpG received 10 µg per mouse per dose. Data is presented as average ± standard deviation. One-way ANOVA coupled with Tukey’s correction for multiple comparisons was performed for day 42 titers and significance is indicated as follows: **** = p ≤ 0.0001. ns = not statistically significant.