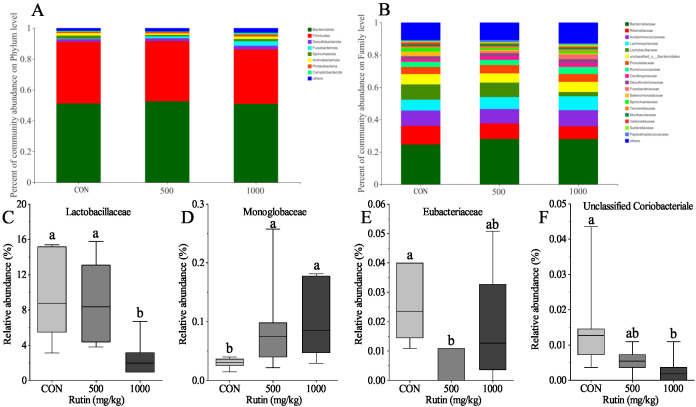
Figure 3.
Beta diversity of caecal microflora composition in aged laying hens. (A,B) bar plots of microbial composition at phylum (A) and family (B) levels; (C–F), significantly differential bacteria taxa at family levels. Data are presented as mean ± SEM and analyzed by Kruskal-Wallis H test. Different lower-case letters indicate a significant difference among different groups (P < 0.05).

