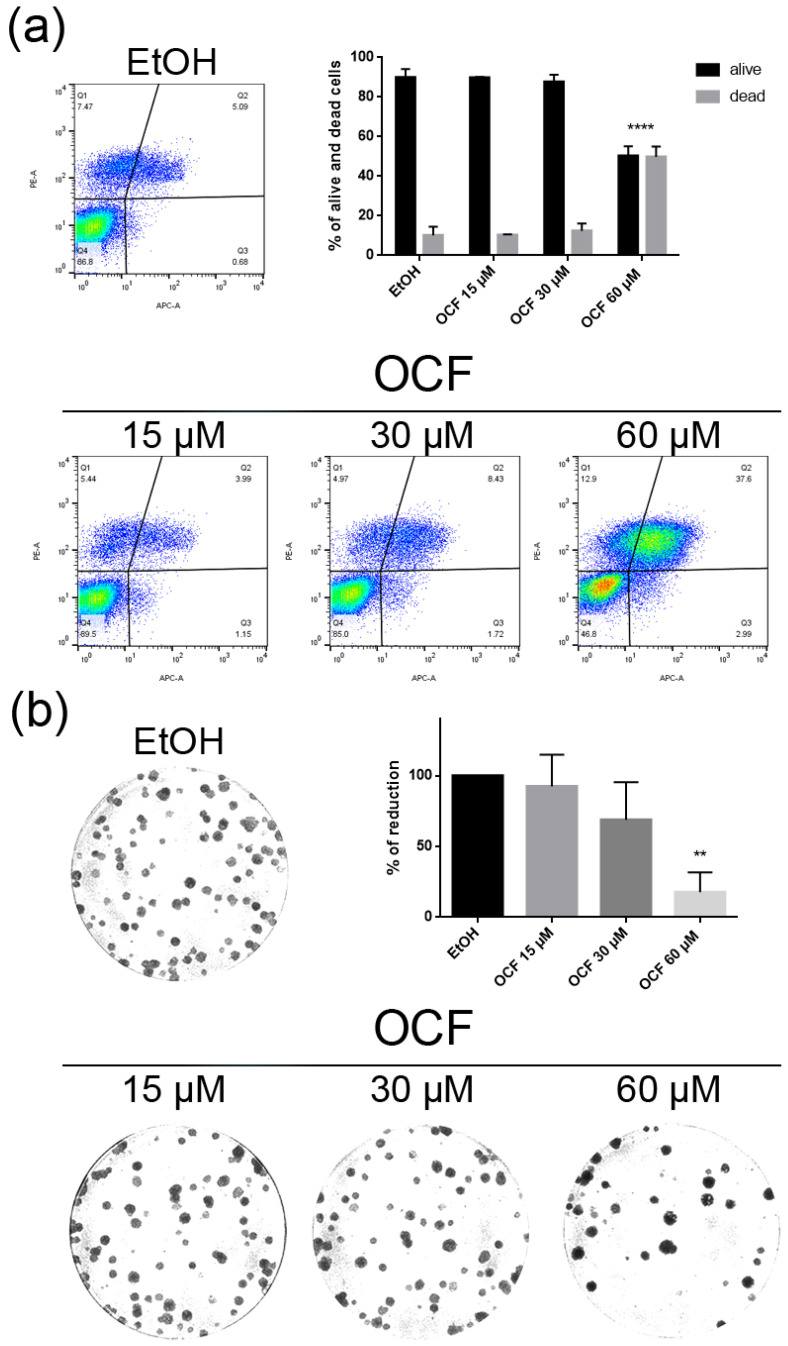
Figure 3.
Vitality and colony formation assay of the OCF-treated AGS wt cells. AGS wt cells were treated for 72 h with vehicle or different doses of the OCF; plots and corresponding histograms for the live/dead cells percentages obtained using annexin V/PI double staining, are shown (a). Cell colonies obtained after 72 h of the vehicle/OCF treatment and corresponding percentage quantification (b). Data are presented as mean ± SD of three independent experiments. Results of the representative experiments are shown. ** p < 0.01, **** p < 0.0001. (a) Two-way ANOVA Tukey’s multiple comparisons test; (b) One-way ANOVA Dunnett’s multiple comparisons test.

