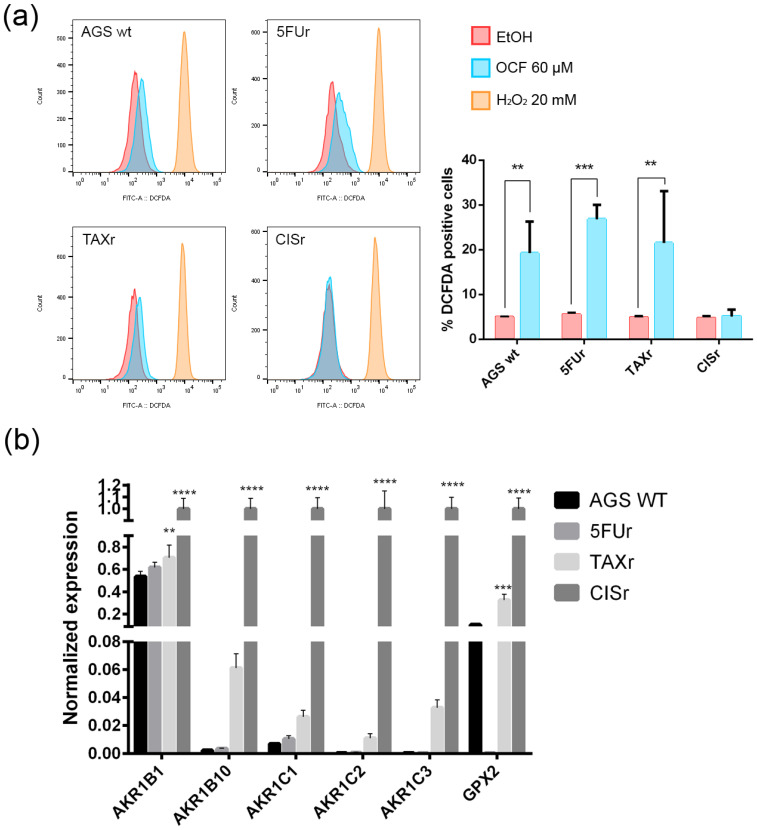
Figure 10.
ROS production by the OCF treatment and the antioxidant enzymes levels. Flow cytometry graphs and the corresponding ROS quantification in the cells treated for 72 h with vehicle or with a 60 µM dose of the OCF (a). Real-Time PCR analyses for the antioxidant enzymes in the AGS wt, 5FUr, TAXr and CISr cells (b). Data are presented as mean ± SD of three independent experiments. Results of the representative experiments are shown. ** p < 0.01, *** p < 0.001; **** p < 0.0001; (a) two-way ANOVA Sidak’s multiple comparisons test; (b) Two-way ANOVA Dunnett’s multiple comparisons test.

