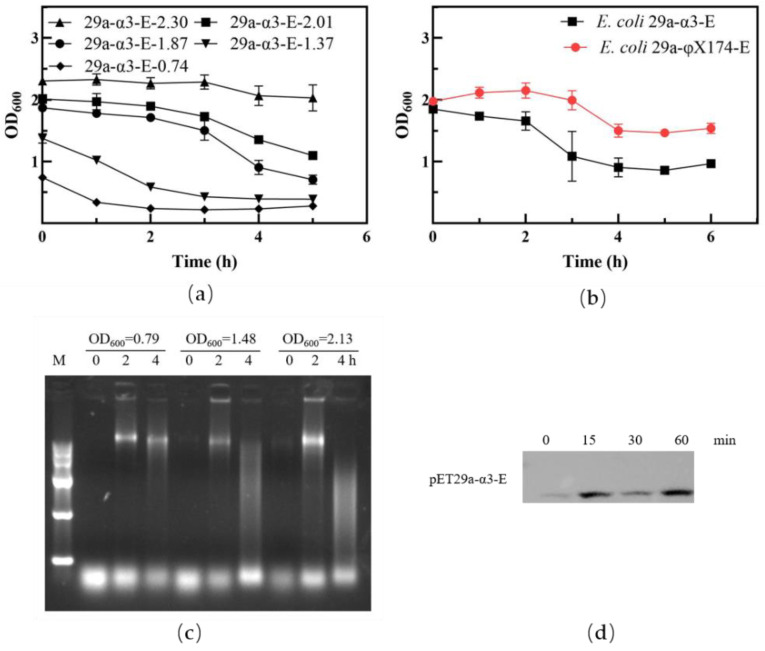
Figure 1.
Effect of lysis protein E in bacteria. (a) Lysis curve of E. coli BL21(DE3) containing the pET29a-α3-E plasmid at different induction starting points. (b) Comparative analysis of lysis function in E. coli BL21(DE3) containing different lysis plasmids. (c) Electrophoretic analysis of genetic material in the supernatant of E. coli BL21(DE3) cultures before and after lysis. (d) Western blot of lysis protein E from phage α3.

