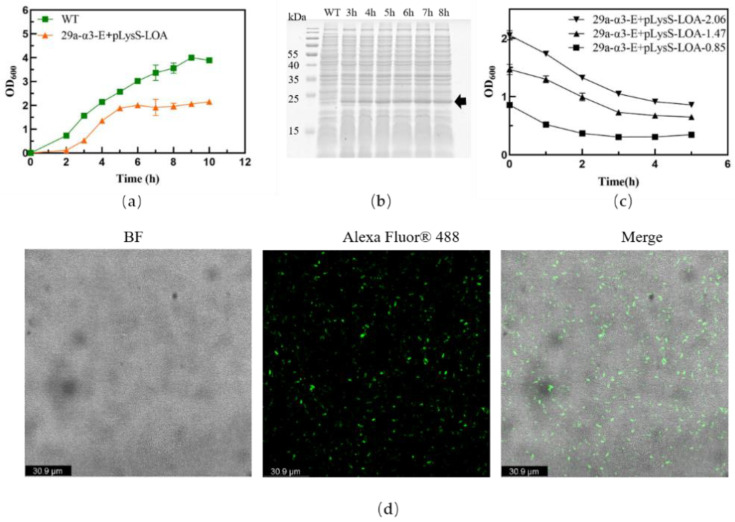
Figure 2.
Lpp-OmpA-ATRAM on the EcN/ΔtnaA::T7 RNAP membrane surface. (a) The growth curves of EcN/ΔtnaA::T7 RNAP/pLysS-LOA and EcN/ΔtnaA::T7 RNAP (WT). (b) SDS-PAGE gel photo showing expression levels of Lpp-OmpA-ATRAM over time. The black arrow indicates the target protein. (c) Lysis curves of EcN/ΔtnaA::T7 RNAP/ pET29a-α3-E after different induction starting points. (d) Confocal images of Lpp-OmpA-ATRAM on the engineered bacterial membrane surfaces. The green fluorescence is derived from the expression of Lpp-OmpA-ATRAM, scar bar is 30.9 μm.

