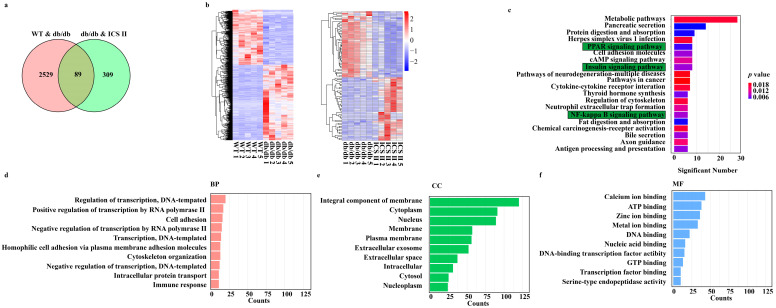
Figure 3.
Analysis of DEGs profiling of the liver in mice. (a) The DEGs between WT versus db/db groups and ICS II versus db/db groups were summarized in a Venn diagram. (b) The correlation coefficients between altered gene expression profiles were analyzed using hierarchical clustering analysis. (c) Top KEGG pathways enriched with DEGs and their matching P values. (d–f) Bar graph shows the fold enrichment values of the top 10 most significantly enriched terms for the regulation of genes, analyzed by GO terms.

