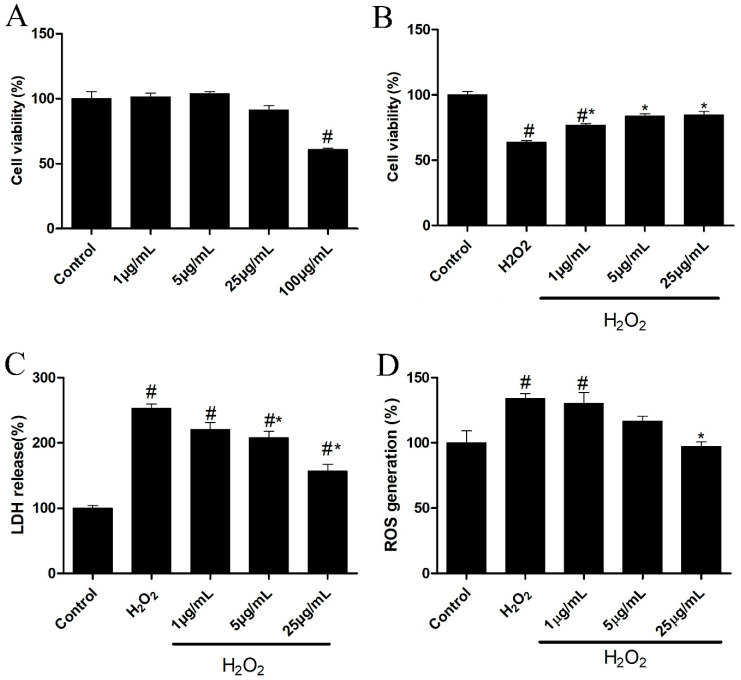
Figure 10.
Effects of OLNZ in H2O2-induced neuronal cell death in vitro: (A) The non-toxic concentration of OLNZ in SH-SY5Y cells was estimated using the MTT assay; (B) Cell viability in H2O2-mediated toxicity was also evaluated using the MTT assay; (C) The release of cytotoxic marker LDH (%); and (D) the oxidative stress marker ROS was examined. Data were expressed as the mean ± SEM, and the experiment was repeated three times. # and * indicate a statistically significant difference compared with the control and H2O2 treatment alone, respectively, p < 0.05. the oxidative stress marker.

