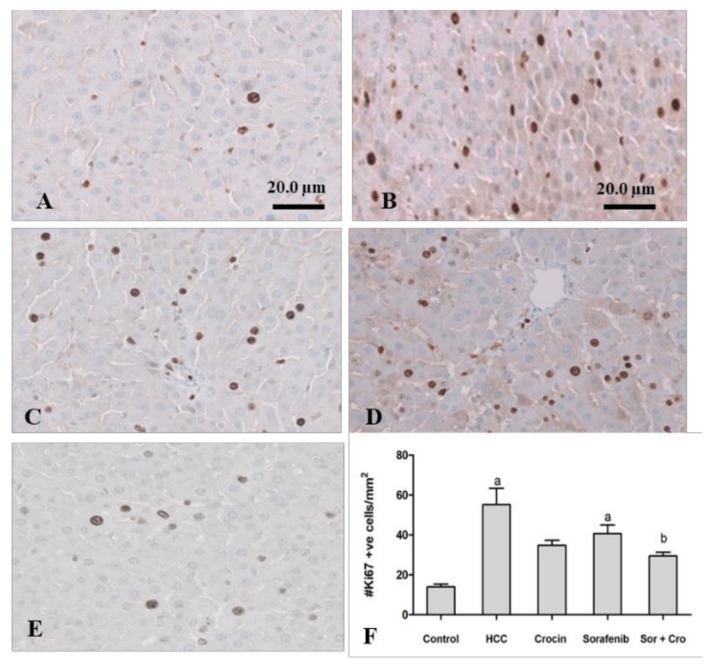
Figure 3.
Antitumor effect of crocin and sorafenib on cell proliferation. Representative images of immunohistochemical staining with Ki-67 in control group (A). HCC group (B). crocin-treated group (C). sorafenib-treated group (D), and Crocin/sorafenib treated group (E). Panel (F) shows the quantitative analysis of Ki-67 immunoreactive cells in 10 fields of each section of the Ki-67 positive foci and quantitative region analysis of the Ki-67–positive foci ×100 magnification (Scale bar 20 µm). The values were evaluated by one-way ANOVA followed by Dunnett’s t-test compared to the HCC-induced group. Data are represented as mean ± SEM. The letter (a) is used for p < 0.05 vs. control group and the letter (b) is used for p < 0.05 vs. HCC group.

