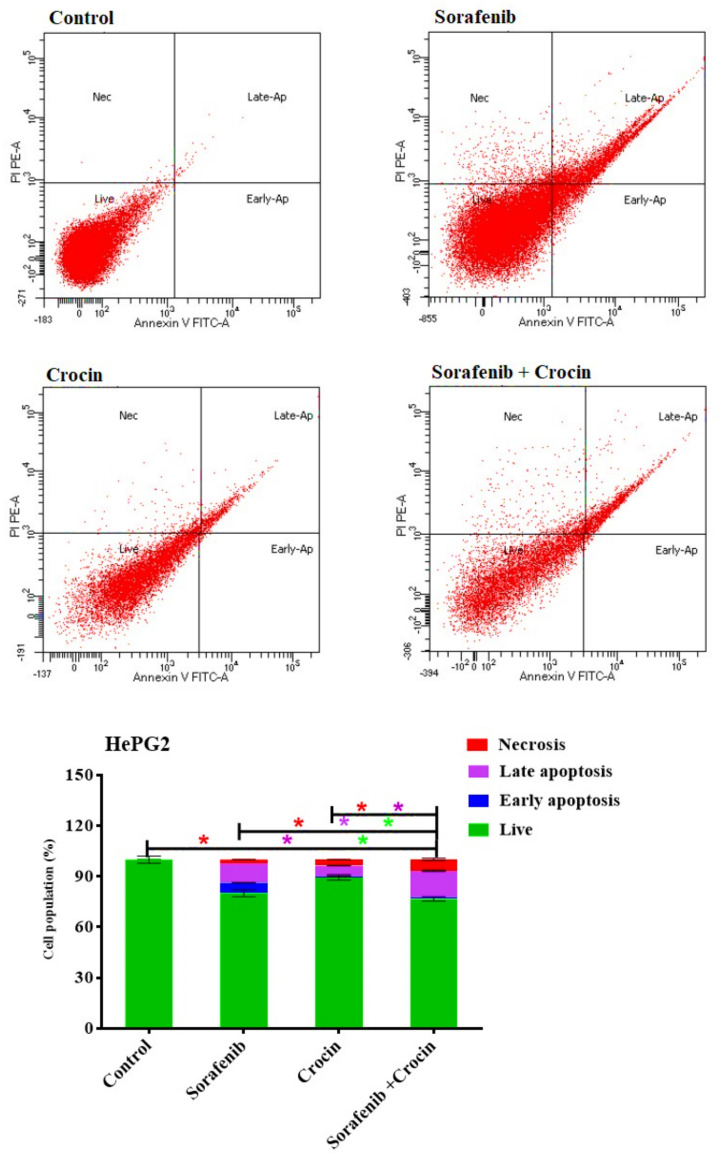
Figure 6.
DNA cytometry analysis of Annexin V-FITC showing representative flow cytometry panels of apoptosis, necrosis, and cell vitality of HePG2 in response to 48 h exposure to media only (control) or (sorafenib, crocin, and (sorafenib/crocin), respectively). Cells population (%), including early apoptosis, late apoptosis, necrosis, and total cell death for the different treatments were shown in the lower panel. All data were presented as mean ± SEM for three replicates (n = 3). Differences were considered significant at * p < 0.05.

