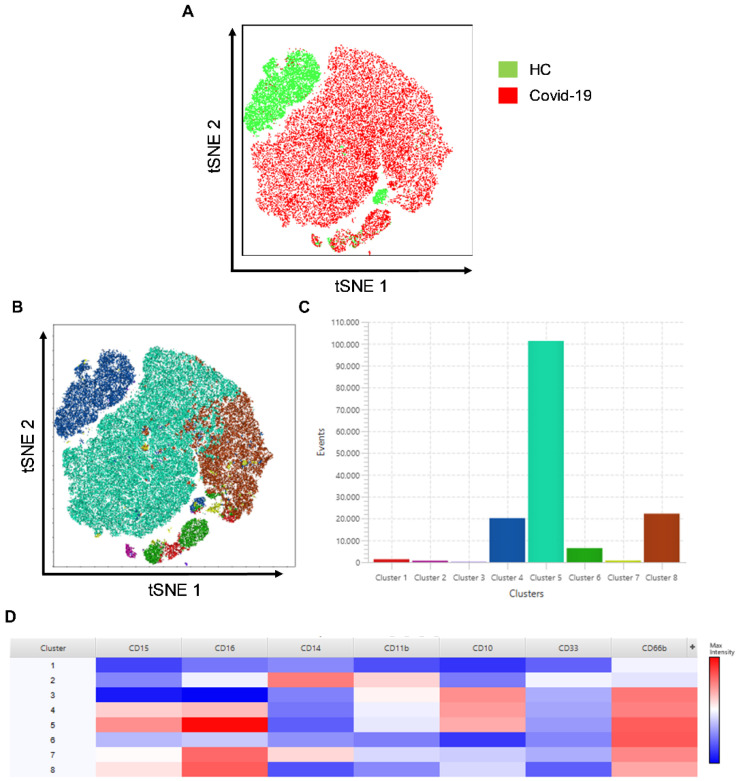
Figure 3.
Distinct neutrophil clusters in COVID-19 patients in t-SNE. (A) Representation of samples from COVID-19 patients and healthy control by unified in t-SNE analysis, demonstrating difference in clustering of CD66b+ live-cell populations. (B) t-SNE graph with 8-cluster FlowSOM analysis. (C) Graph demonstrating the number of events of each cluster. (D) Heatmap analysis of the clusters demonstrating the cell markers.

