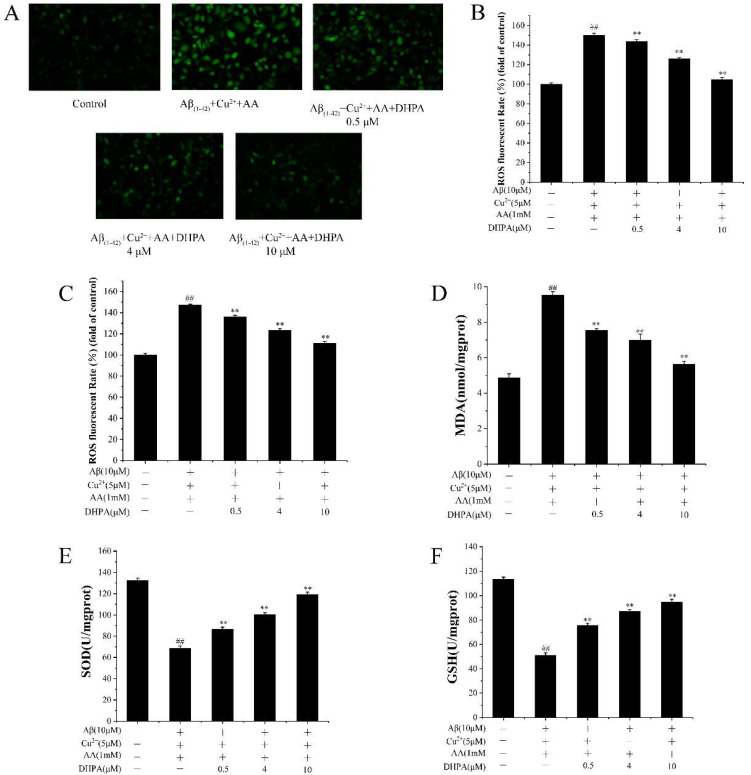
Figure 4.
The effects of DHPA on the related antioxidant indices in SH-SY5Y cells. Intracellular ROS fluorescence images (A), intracellular ROS production (B,C), the content of MDA (D), and the activities of SOD (E) and GSH (F). For (C), the cells were pre-treated with Aβ/Cu2+/AA for 6 h, and washed afterward, with different concentrations of DHPA added. For the other experiments, Aβ/Cu2+/AA and DHPA were mixed for cell incubation. ## p < 0.01 compared to the control group, ** p < 0.01 compared to the Aβ/Cu2+/AA-treated group.

