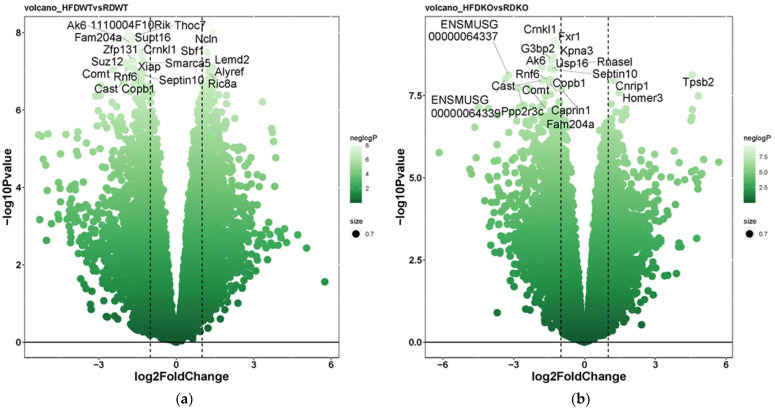
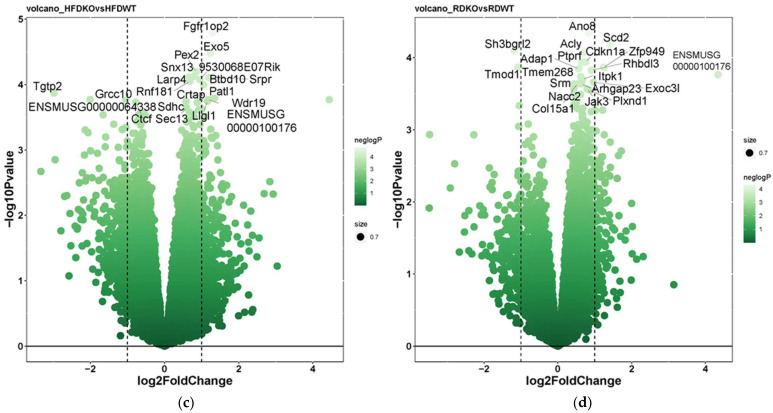
Figure 7.
Volcano plots depicting differential eWAT expression patterns across diet (chow or HFD) or genotype (Lama4fl/fl mice or Lama4AKO) comparisons. (a) High-fat vs. chow diet comparison in Lama4fl/fl mice; (b) High-fat vs. chow diet comparison in Lama4AKO mice; (c) Lama4fl/fl mice vs. Lama4AKO mice on a high-fat diet; (d) Lama4fl/fl mice vs. Lama4AKO mice on chow diet. RD = chow diet, HFD = high-fat diet, WT = Lama4fl/fl and KO = Lama4AKO. The top 20 differentially expressed genes are annotated in each volcano plot, with full gene names appearing in Appendix B. Dashed lines represent the significance cutoffs for identifying genes as significantly regulated.


