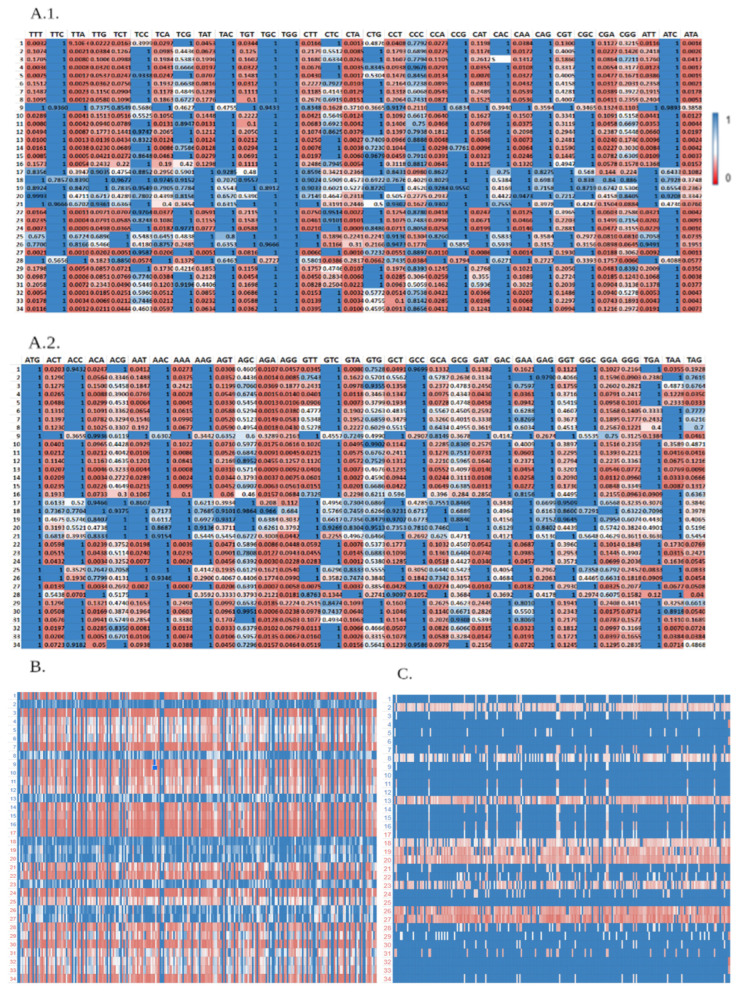
Figure 10.
Translation efficiency optimization of the (A.1,A.2). thaliana microbiome, using the calculated CUB scores of all codons shown in figure (A.1,A.2), the initial scores of the ZorA gene in (B), and the final scores of the gene in C. The names of the organisms represented by the numbers in (A.1,A.2) and in (B,C) are detailed in Table A1 and Table A2 respectively.

