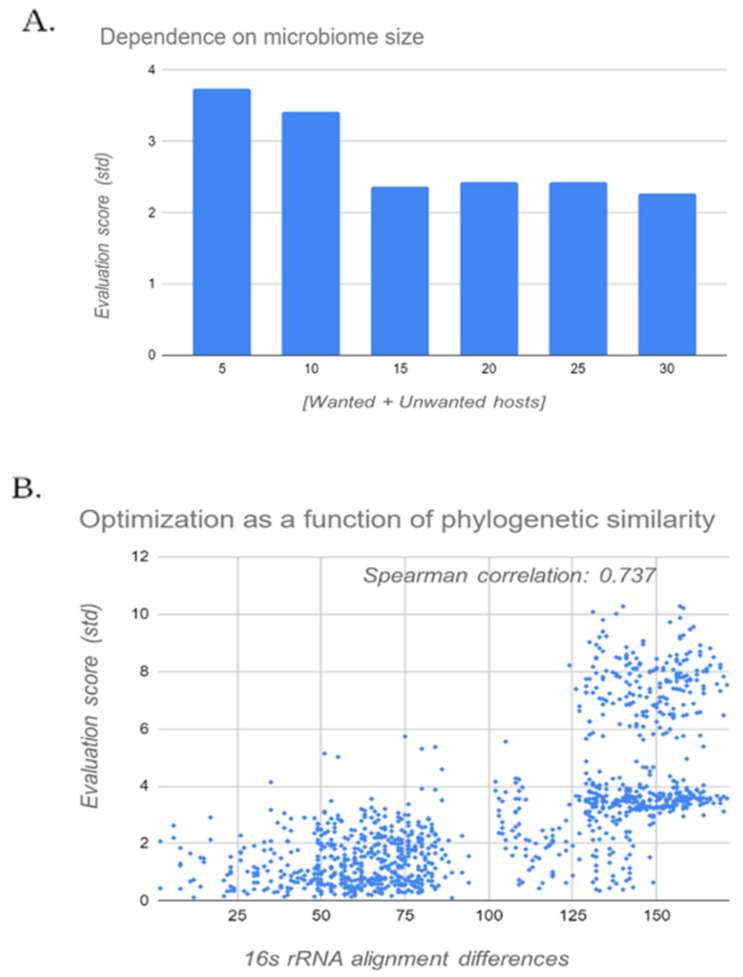
Figure 11.
Final test of algorithm resolution and scale up: (A) examines 10 random splits of chosen sizes, averaged; and (B) shows the correlation between the performance of the model and the evolutionary distance between a pair of species (defined as the number of differences in the alignments of the 16S rRNA sequences).

