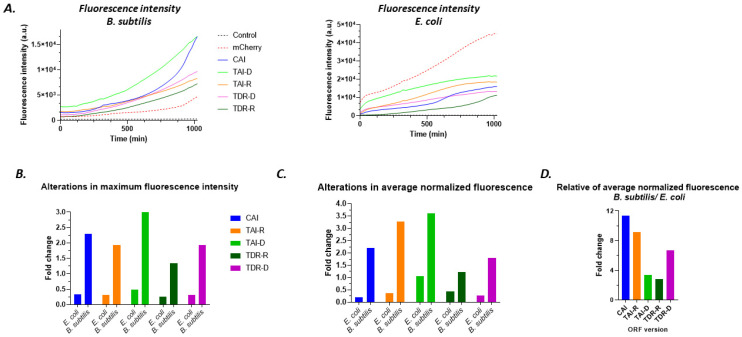
Figure 16.
(A). Representative fluorescence intensity plots of all ORF variants in B. subtilis (left) and in E. coli (right). Note that the control lacked mCherry gene, and thus wasn’t exhibited fluorescence, and served for background subtraction; (B) fold change in average maximal fluorescence intensity of each ORF version relative to mCherry (unmodified version); (C) the same as in (B) but calculated for the average normalized fluorescence; and (D) fold of average normalized fluorescence in B. subtilis relative to E. coli.

