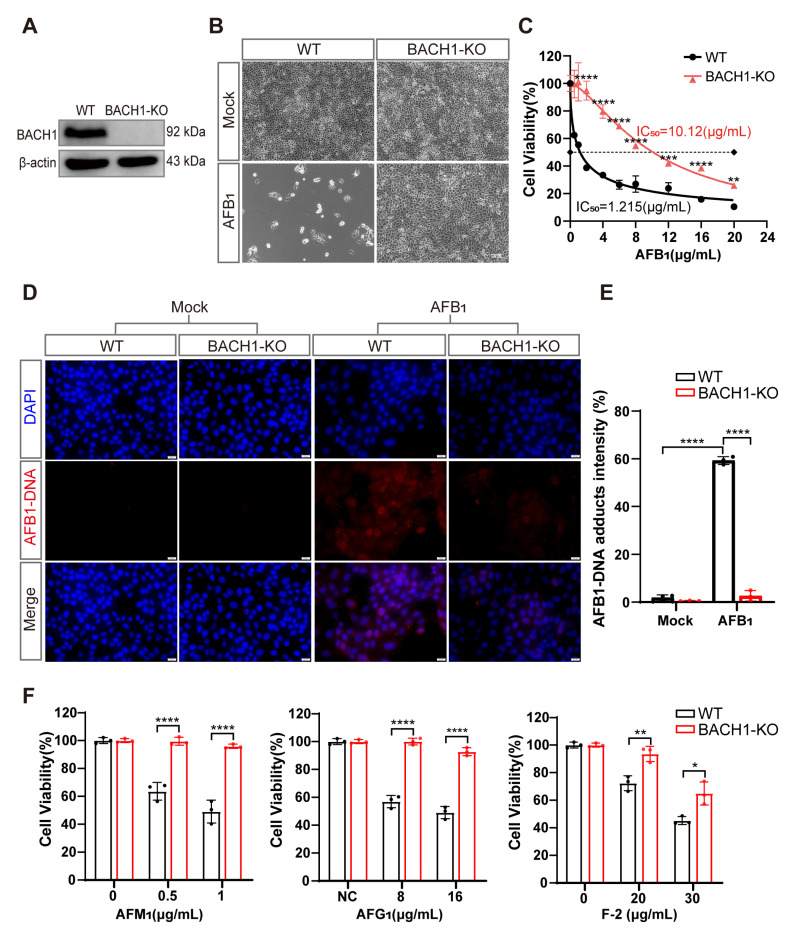
Figure 2.
BACH1 knockout cells exhibit higher resistance to aflatoxin B1. (A) Western blot analysis of BACH1 expression in WT and KO cells. (B) Representative images of WT and BACH1-KO PK-15 cells challenged with 2 μg/mL AFB1 for 48 h. Scale bar, 100 μM. (C) The IC50 values for AFB1 in WT and BACH1-KO cells determined by CCK-8 assays. (D,E) Immunofluorescence staining of AFB1-induced DNA adduct formation in WT and BACH1-KO cells; relative fluorescence intensity calculated using ImageJ software. Scale bar, 20 μM. (F) Enhanced resistance to AFM1, AFG1, and F-2 in BACH1-KO cells. WT and BACH1-KO cells were treated with AFM1 (at 0.5 μg/mL and 1 μg/mL), AFG1 (at 8 μg/mL and 10 μg/mL), and F-2 (at 20 μg/mL and 30 μg/mL) for 36 h. Cell viability was measured with CCK-8 assays. * p < 0.05, ** p < 0.01, *** p < 0.001, **** p < 0.0001. p values were determined with two-tailed Student’s t-tests. AFB1, aflatoxin B1; AFG1, aflatoxin G1; F2, zearalenone; WT, wild-type; KO, knockout.

